



Most HVAC businesses sit on equipment data they never use. Serial numbers, install dates, service histories, repair frequencies—everything needed for a preventive maintenance program that actually generates predictable monthly revenue. The problem isn't collecting information. It's turning scattered service records into a system that works without constant babysitting.
A commercial HVAC contractor I worked with had 1,400 pieces of equipment under contract across 180 buildings. Their PM scheduling? A spreadsheet and whatever the dispatcher remembered. Techs would drive to service a rooftop unit that got replaced six months earlier. Meanwhile, a 22-year-old chiller at a medical office sat untouched for 18 months because someone forgot to reschedule after a service call got moved.
They had all the data they needed in their service software. Install dates, tonnage, operating hours, repair histories, notes about problem units. Without a way to convert that raw information into risk scores and service levels, they were guessing at everything. Their renewal rate was 65%, and emergency calls from contract customers destroyed whatever margins they managed to squeeze out.
Building a proper PM program isn't about predictive analytics or IoT sensors. It's about using equipment data you already collect to create scoring systems that tell you which units need attention, how often to service them, and what to charge based on actual risk. When structured right, maintenance contracts stop being break-even propositions and start generating 35-40% gross margins while cutting those profit-killing emergency callbacks.
Asset Risk Scoring: The Foundation Everyone Gets Wrong
Every piece of HVAC equipment has a failure probability you can calculate from basic data. Age, usage intensity, environment, maintenance history, manufacturer reliability—these create a risk profile that should drive your entire PM strategy. Most contractors treat a 2-year-old Carrier in a clean office the same as a 15-year-old Goodman on a restaurant roof. That's like charging the same insurance premium for a teenager and a 50-year-old with a perfect driving record.
Equipment age forms your baseline. Units under 5 years get a 1.0 factor. Years 6-10 bump to 1.3. Years 11-15 hit 1.6. Over 15 years gets 2.0. This reflects how component failures increase exponentially as equipment ages past design life.
Operating environment matters just as much. Clean office spaces score 1.0. Retail with moderate dust jumps to 1.2. Restaurants with grease-laden air hit 1.5. Manufacturing facilities can reach 2.0 depending on airborne contaminants. Identical rooftop units fail three times faster in a bakery versus an accounting firm, purely from flour dust clogging condensers.
Usage intensity gets overlooked constantly. A unit running 8 hours daily in an office scores differently than one running 24/7 in a server room. Calculate annual runtime hours: under 2,000 hours stays at 1.0, 2,000-4,000 hours gets 1.3, 4,000-6,000 hits 1.6, anything over 6,000 hours jumps to 2.0.
Previous repair frequency tells you which units are problem children. Pull twelve months of service history. Units with zero repairs beyond PM visits score 0.8. One to two repairs bump to 1.0. Three to four repairs hit 1.5. More than four repairs in a year? That's a 2.0 multiplier screaming for attention.
Manufacturer reliability adjustments come from your own service data, not industry averages. Track failure rates by brand and model across your customer base. That Lennox unit everyone says is bulletproof might fail constantly in your market's humidity. Your data tells the real story.
Operational software automates these calculations across hundreds of units. Instead of manually tracking risk factors in spreadsheets, AI-powered platforms continuously update scores based on service data, automatically flagging high-risk equipment before it fails. The system adjusts PM schedules when risk scores cross thresholds.
Service Tier Structure That Prevents Failures
Once equipment is scored, you need service tiers matching risk levels to visit frequencies. The standard "quarterly for everyone" approach leaves money on the table while allowing preventable failures.
Eliminate scheduling chaos and missed jobs.
Coolyly helps HVAC companies book, coordinate, and track every service efficiently.
- Unified appointment & dispatch management
- Automated client notifications
- Technician scheduling & job tracking
No credit card required
Low Risk (Score 0-2.5) Newer units in clean environments with solid maintenance histories. Bi-annual service works—spring and fall checks, filter changes, coil cleaning, refrigerant verification. Contract pricing reflects minimal risk: $180-250 annually residential, $400-600 light commercial.
Standard Risk (Score 2.6-4.0) Units aged 5-10 years in normal environments. Quarterly visits: spring startup, summer performance check, fall transition, winter heating verification. Price these at $380-480 residential, $800-1,200 commercial depending on tonnage.
Elevated Risk (Score 4.1-6.0) Older units or harsh environments need attention every two months. These visits catch refrigerant leaks, worn contactors, and clogged drains before they cause failures. Pricing jumps to $580-750 residential, $1,500-2,200 commercial.
High Risk (Score 6.1+) Problem units that should probably be replaced but customers aren't ready. Monthly visits focusing on predictive replacement of components showing wear. Price these at $900-1,200 residential, $2,800-3,600 commercial. Include contract language about recommended replacement.
Higher-tier contracts generate better margins because you're preventing expensive emergency calls. A high-risk contract might seem expensive, but when you prevent two compressor failures a year, both you and the customer win.
Modern operational platforms handle this tiering automatically. As equipment ages or repair frequency increases, the system suggests tier upgrades to customers with risk data justifying the additional investment.
Contract Economics That Actually Work
Traditional HVAC maintenance contracts barely break even because they're priced on hope rather than data. You hope equipment doesn't break. Customers hope you'll fix everything under contract. Nobody calculates real economics.
Start with true cost per PM visit. Not just tech wages—include vehicle costs, parts inventory, scheduling overhead, administrative burden. Most contractors discover their real PM visit cost is $95-125, not the $65 they assumed. Add target gross margin (35-40% for well-run programs) and you have baseline pricing.
Component coverage tiers based on risk scores changes everything. Instead of covering all repairs under blanket contracts, create coverage levels aligning with equipment risk profiles.
Basic Coverage (Low Risk)
-
All PM visits
-
Basic consumables (filters, belts)
-
Minor adjustments
-
Priority scheduling
-
15% repair discount
Standard Coverage (Standard Risk)
-
Everything in Basic
-
Capacitors and contactors
-
Thermostats
-
Fan motors under 1HP
-
$500 annual repair allowance
Comprehensive Coverage (High Risk)
-
Everything in Standard
-
All motors
-
Control boards
-
Refrigerant leaks under 3 pounds
-
$1,500 annual repair allowance
A 12-year-old rooftop unit has roughly 35% chance of major component failure annually. At $2,100 for comprehensive coverage, you're collecting $6,000 from every three customers while likely paying out one $3,500 repair. That's 42% gross margin on high-risk equipment.
The math becomes even more compelling when you track failure rates by tier over time. Low-risk equipment should rarely need emergency calls. If it does, your scoring system needs adjusting.
KPI Framework for Program Health
You can't improve what you don't measure, but most HVAC contractors track wrong metrics for PM programs. Revenue and customer count tell you nothing about program health or profitability.
Contract Gross Margin by Tier This reveals whether risk-based pricing actually works. Low-risk should hit 45-50% margins. Standard targets 35-40%. Elevated drops to 30-35% due to increased visits. High-risk might only hit 25-30%, but prevents emergency call losses.
PM Completion Rate Incompletion kills programs. Track percentage of scheduled PM visits actually completed within the service window. Below 90% means scheduling problems. Below 80% means you're creating your own emergency calls.
Emergency Call Rate by Tier This validates your entire framework. Low-risk equipment should generate less than 0.5 emergency calls annually per unit. Standard stays under 1.0. Elevated might hit 1.5. High-risk could reach 2-3. If low-risk units are calling for emergency service, your scoring system needs adjustment.
Tier Migration Rate Track how equipment moves between tiers over time. Normal aging should move 15-20% of units up one tier annually. If 40% are jumping tiers, you're not visiting frequently enough. If only 5% migrate, you might be over-servicing.
Contract Renewal Rate by Tier Low-risk should renew at 85-90% (minimal cost, clear value). Standard hits 75-80%. Elevated drops to 65-70%. High-risk might only retain 50-60%, often because customers finally replace equipment.
These KPIs become powerful when tracked in operational software connecting contract data with service histories. AI automation identifies patterns humans miss—like certain building types consistently requiring tier upgrades, or specific equipment models needing modified PM schedules.
Sample Risk Scoring Implementation
Unit A: 2019 Carrier 5-ton rooftop
-
Age factor
1.0 (5 years old)
-
Environment
1.0 (office building)
-
Runtime
1.3 (3,200 hours annually)
-
Repair history
0.8 (zero repairs)
-
Model adjustment
0.9 (reliable model)
Total score: 1.0 × 1.0 × 1.3 × 0.8 × 0.9 = 0.94
Low-risk with bi-annual service. Classic equipment that doesn't need quarterly attention.
Unit B: 2014 Goodman 3-ton split
-
Age factor
1.3 (10 years old)
-
Environment
1.5 (restaurant)
-
Runtime
1.6 (5,500 hours annually)
-
Repair history
1.5 (three repairs last year)
-
Model adjustment
1.2 (higher failure rate)
Total score: 1.3 × 1.5 × 1.6 × 1.5 × 1.2 = 5.62
Elevated risk requiring bi-monthly visits. Age, harsh environment, and repair history create significant risk.
Unit C: 2008 Trane 10-ton rooftop
-
Age factor
2.0 (16 years old)
-
Environment
1.2 (retail store)
-
Runtime
1.3 (3,800 hours annually)
-
Repair history
2.0 (six repairs last year)
-
Model adjustment
0.8 (typically reliable)
Total score: 2.0 × 1.2 × 1.3 × 2.0 × 0.8 = 4.99
Despite being a generally reliable Trane unit, age and repair frequency push this into elevated risk. Probably needs replacement soon.
Below is a visual workflow for calculating risk scores, mapping them to tiers, and updating PM schedules.
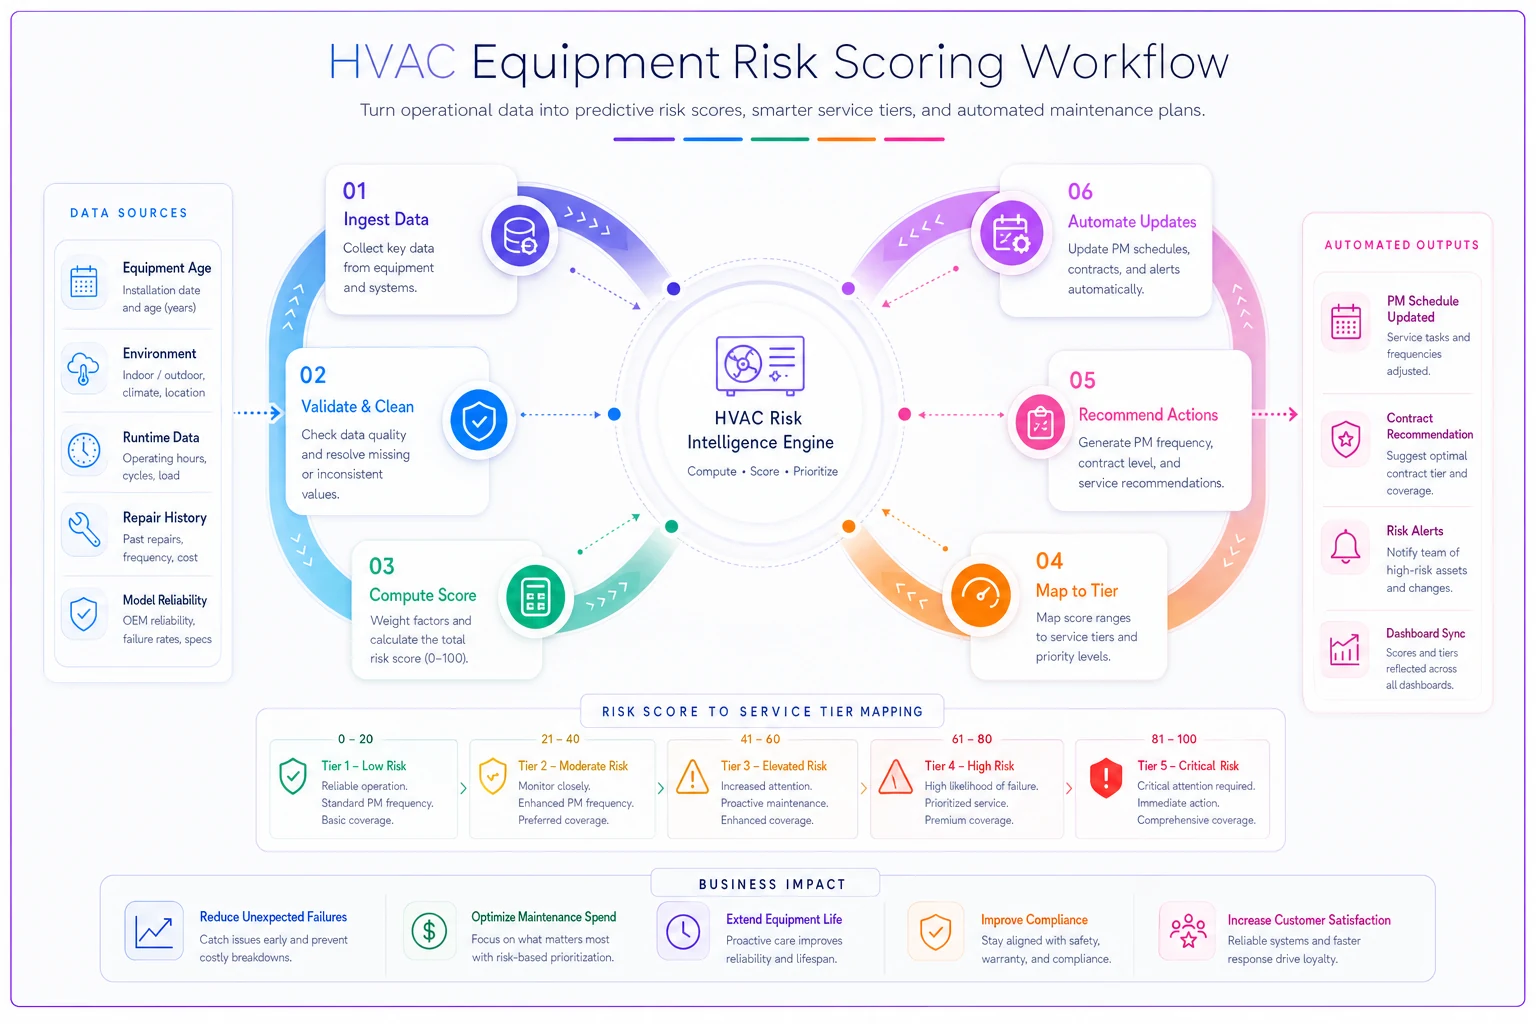
The scoring catches nuances. The newer Carrier in clean environment scores under 1.0, while the old Trane with constant repairs hits nearly 5.0 despite being a "good" brand. This granularity prevents both over-servicing and under-servicing.
Contract Templates by Risk Profile
Your contract language should reflect risk level and service intensity of each tier. Generic one-size-fits-all contracts lead to disputes and unclear expectations.
Low-Risk Contract Core Language: "Semi-annual preventive maintenance service includes comprehensive inspection, filter replacement, coil cleaning as needed, and verification of operating parameters. Customer acknowledges equipment is in good working condition with low failure risk based on age and operating conditions."
Elevated-Risk Contract Core Language: "Bi-monthly preventive maintenance reflects elevated equipment risk due to age/environment/usage factors. Service includes proactive component monitoring, predictive replacement recommendations, and enhanced diagnostic procedures. Customer acknowledges equipment shows signs of wear requiring increased attention to prevent failures."
| Component | Low Risk | Standard | Elevated | High Risk |
|---|---|---|---|---|
| Filters | Included | Included | Included | Included |
| Capacitors | Not covered | 15% discount | Covered | Covered |
| Contactors | Not covered | 15% discount | Covered | Covered |
| Motors <1HP | Not covered | Not covered | Covered | Covered |
| Motors >1HP | Not covered | Not covered | 25% discount | Covered |
| Refrigerant | Not covered | Not covered | 3 lbs/year | 5 lbs/year |
| After-hours | Standard rate | 10% discount | 20% discount | 30% discount |
Add escalation clauses for tier changes: "Should equipment risk score increase due to age, repairs, or operating changes, service tier and pricing may be adjusted at renewal with 60-day notice."
Modern operational platforms generate these contracts automatically based on equipment profiles, eliminating manual document creation while ensuring consistent terms.
Revenue Forecasting and Growth Modeling
Once you've built a data-driven framework, forecasting becomes accurate. You know equipment mix, risk distributions, and tier pricing. The math tells you exactly what's possible.
-
30% low-risk units at $400 average = $120,000
-
40% standard units at $900 average = $360,000
-
25% elevated units at $1,800 average = $450,000
-
5% high-risk units at $3,200 average = $160,000
Total portfolio value: $1,090,000 annually
As equipment ages, roughly 20% of your portfolio moves up one tier each year. Those low-risk units becoming standard add $500 each in annual revenue. Standard moving to elevated adds $900 each. Without adding a single new customer, your portfolio grows 12-15% annually through tier migration alone.
Factor in new customer acquisition and the compound effect accelerates. Adding 100 new units quarterly with the same tier distribution:
-
Base portfolio after migration
$1,220,000
-
400 new units added
$436,000
-
Year 2 total
$1,656,000 (52% growth)
The real leverage comes from retention. Every percentage point improvement in renewal rates compounds. Moving from 70% to 80% retention adds $109,000 in recurring revenue that continues growing through tier migration.
Operational Challenges and Scaling Considerations
Implementation reveals friction points that can sink the entire program if not addressed upfront.
Technician adoption becomes your first battle. Techs comfortable with break-fix work resist perceived tedium of PM visits. They don't see value in checking equipment that's working fine.
Align technician incentives with PM quality metrics rather than speed.
The fix isn't training on the importance of preventive maintenance. It's restructuring compensation to reward thoroughness over speed, and providing diagnostic tools that make PM visits more interesting than just changing filters.
Scheduling complexity explodes with different service frequencies. Low-risk units need service every six months, elevated-risk every two months, high-risk monthly. Without automated scheduling, dispatchers spend hours juggling calendars.
Customer education becomes critical. They need to understand why their 15-year-old restaurant equipment costs more to maintain than their new office unit. Without proper risk score communication, tier upgrades feel like arbitrary price increases.
Quality control gets harder as visit frequency increases. A tech might visit 40 different pieces of equipment weekly across multiple tiers. Ensuring consistent service levels requires checklists, photo documentation, and regular auditing.
Cash flow impacts can be significant during transition. Moving customers from annual contracts to monthly billing improves cash flow but requires new billing systems. Some customers resist monthly payments even if annual cost stays the same.
Modern operational software addresses most of these challenges through automation. AI-powered platforms handle complex scheduling, generate risk-based proposals, track quality metrics, and manage billing transitions. The technology handles operational complexity so you can focus on growing profitable maintenance revenue.
The payoff justifies the effort. Contractors who nail preventive maintenance economics typically see 40%+ of revenue from recurring contracts within three years. That's predictable cash flow that funds growth while reducing the constant pressure of finding new emergency service calls to pay overhead.
The payoff justifies the effort. Contractors who nail preventive maintenance economics typically see 40%+ of revenue from recurring contracts within three years. That's predictable cash flow that funds growth while reducing the constant pressure of finding new emergency service calls to pay overhead.
Ready to optimize your HVAC operations?
Join hundreds of HVAC businesses using Coolyly to save time, improve technician utilization, and enhance customer satisfaction.