



Every HVAC owner knows the pattern. The first 95-degree week hits and the phones don't stop. Techs are running 11-hour days, the schedule board looks like a disaster, and payroll comes in 30% higher than you budgeted. Then October rolls around and half your guys are hunting for hours.
The problem isn't that demand swings — it always does. The problem is that most shops react to the swing instead of planning around it. And the tool they reach for by default — overtime — is the single most expensive way to add capacity.
This is a walkthrough of how to actually do HVAC seasonal capacity planning with real inputs: how to forecast the surge, when to hire temps versus lean on overtime, and how to smooth demand before it hits so you're not paying time-and-a-half to catch up.
Start with the forecast inputs you actually have
Most shops guess at their seasonal ramp based on feel. That works until the feel is off by two weeks and you've got either idle techs or a two-day backlog staring back at you.
You don't need a data scientist. You need three years of your own dispatch history and a couple of external signals. Here's what actually moves the needle:
-
Your own call volume by week, last 3 years. Pull the number of service calls booked per week, not per month. Monthly hides the spike. You'll usually see the ramp start in a specific 10-day window every year.
-
Cooling degree days (CDD) / heating degree days (HDD). Free from NOAA for your region. Overlay CDD against your call volume from last year and the correlation is usually tight enough to predict within a few days.
-
Extended forecasts (7–14 day). Not the daily weather — the trend. Five straight days above 90 is your early-warning siren.
-
Install backlog aging. If your install side is quoting three weeks out in early June, your service side is about to get slammed. They move together.
-
Maintenance agreement calendar. These are demand you already control. Knowing you've got 180 PM visits due in July changes everything about how you staff.
A typical example: a shop pulls three years of weekly call counts and notices that volume roughly doubles the week after the first three-consecutive-day stretch above 88°F. That's not a vague "summer gets busy" — that's a trigger you can actually plan against. When the 14-day forecast shows that stretch coming, you've got 7–10 days of lead time to move staffing levers.
Pull weekly call counts from your dispatch system rather than monthlies to capture spikes.
The insight most owners miss: your busiest week is almost never the hottest week. It's the week after the first real heat, because that's when marginal systems finally give out and everyone calls at once. If you staff for the hottest week, you're already a week late.
Why overtime becomes the default (and what it really costs)
Overtime feels free because there's no hiring, no onboarding, no interview. You just tell the crew to stay late. That's exactly why it gets abused.
Eliminate scheduling chaos and missed jobs.
Coolyly helps HVAC companies book, coordinate, and track every service efficiently.
- Unified appointment & dispatch management
- Automated client notifications
- Technician scheduling & job tracking
No credit card required
Run the actual math. A tech at $28/hour costs you $42/hour at time-and-a-half. Push a crew of six into 12 hours of OT a week during a 14-week season and you're looking at somewhere around $35k–$42k in overtime premium alone — the extra half you're paying, not the base wages. And that's before the hidden costs.
-
Callback rates climb on hour 10. Tired techs make more mistakes. Callbacks tick up noticeably on jobs completed late in long overtime days. Every callback is a free truck roll you eat.
-
Burnout and turnover. Losing one experienced tech in August costs you a replacement search, ramp time, and the jobs you couldn't run. This ties directly into dispatch fairness rules and workload caps — overtime dumped unevenly on your best people is how you lose them.
-
Diminishing output. Hour 11 doesn't produce like hour 4. You're paying 1.5x for maybe 0.7x the productivity.
Overtime has its place. It's the right tool for a short, sharp spike — a three-day heat wave, a weekend surge. It's the wrong tool for a predictable 14-week season. Using OT for an entire summer is like using a credit card cash advance to pay rent every month.
The temp-vs-overtime decision: run the numbers
Here's the comparison that should drive the call. Plug in your own numbers — this is the framework.
| Factor | Overtime (existing tech) | Seasonal temp / contractor |
|---|---|---|
| Effective hourly cost | ~$42/hr (at $28 base × 1.5) | ~$30–$38/hr all-in |
| Ramp / onboarding | None | 3–10 days |
| Productivity | Declines after ~9 hrs | Full, but lower skill early |
| Callback risk | Rises with fatigue | Rises with unfamiliarity |
| Flexibility to scale down | Instant | Requires end-date planning |
| Best for | Short spikes (1–5 days) | Sustained season (6+ weeks) |
| Morale impact | Negative if prolonged | Neutral to positive (relieves core team) |
The decision rule that works cleanly:
-
Spike is under one week? Use overtime. Not worth onboarding anyone.
-
Spike is 2–5 weeks and skilled work? Overtime for the core, plus pull in a contractor or two for overflow that doesn't need your best diagnostician.
-
Sustained 6+ week season? Lock in contractor capacity before the season, not during it. By the time you're desperate, every other shop is too, and the good contractors are already booked.
-
Repeatable every year? Consider converting one seasonal slot into a permanent hire. If you're paying $40k in OT premium annually, that's most of a salaried tech.
The mistake most shops make: they treat every busy stretch as an emergency and default to OT, then treat every slow stretch as permanent and cut too deep. Both reactions are expensive. Forecasting first lets you match the right lever to the actual shape of the demand.
Smooth the demand before it hits
This is the part almost nobody does, and it's probably the highest-leverage move in the whole playbook. The cheapest capacity is the demand you never had to surge for.
You control more of your seasonal load than you think. Maintenance agreements, tune-ups, filter changes, non-urgent repairs — these can all be shifted out of peak weeks if you run pre-season campaigns. Most shops sit on a meaningful chunk of deferrable work and never think to schedule it intentionally.
Here's the workflow that actually smooths the curve:
Step 1 — Identify your movable demand. Go through your maintenance agreement base and your deferred "call us in the spring" repairs. This is demand that has to happen eventually, just not necessarily in July.
Step 2 — Run pre-season campaigns in the shoulder months. April and May for cooling season, September/October for heating. A discounted spring tune-up isn't just revenue — it pulls July's workload into a month where your techs have unbilled hours. You catch failing capacitors and low refrigerant before they become 100-degree emergency calls.
Step 3 — Book PM visits into your valley weeks. If your forecast shows the second and fourth weeks of June are historically slower, that's where the maintenance agreement visits go. You're using known, controllable demand to fill the dips instead of being idle in the valley and drowning in the peak.
Step 4 — Prioritize existing customers for pre-season slots. They're your most profitable work and the least likely to no-show. Fill the shoulder season with them first.
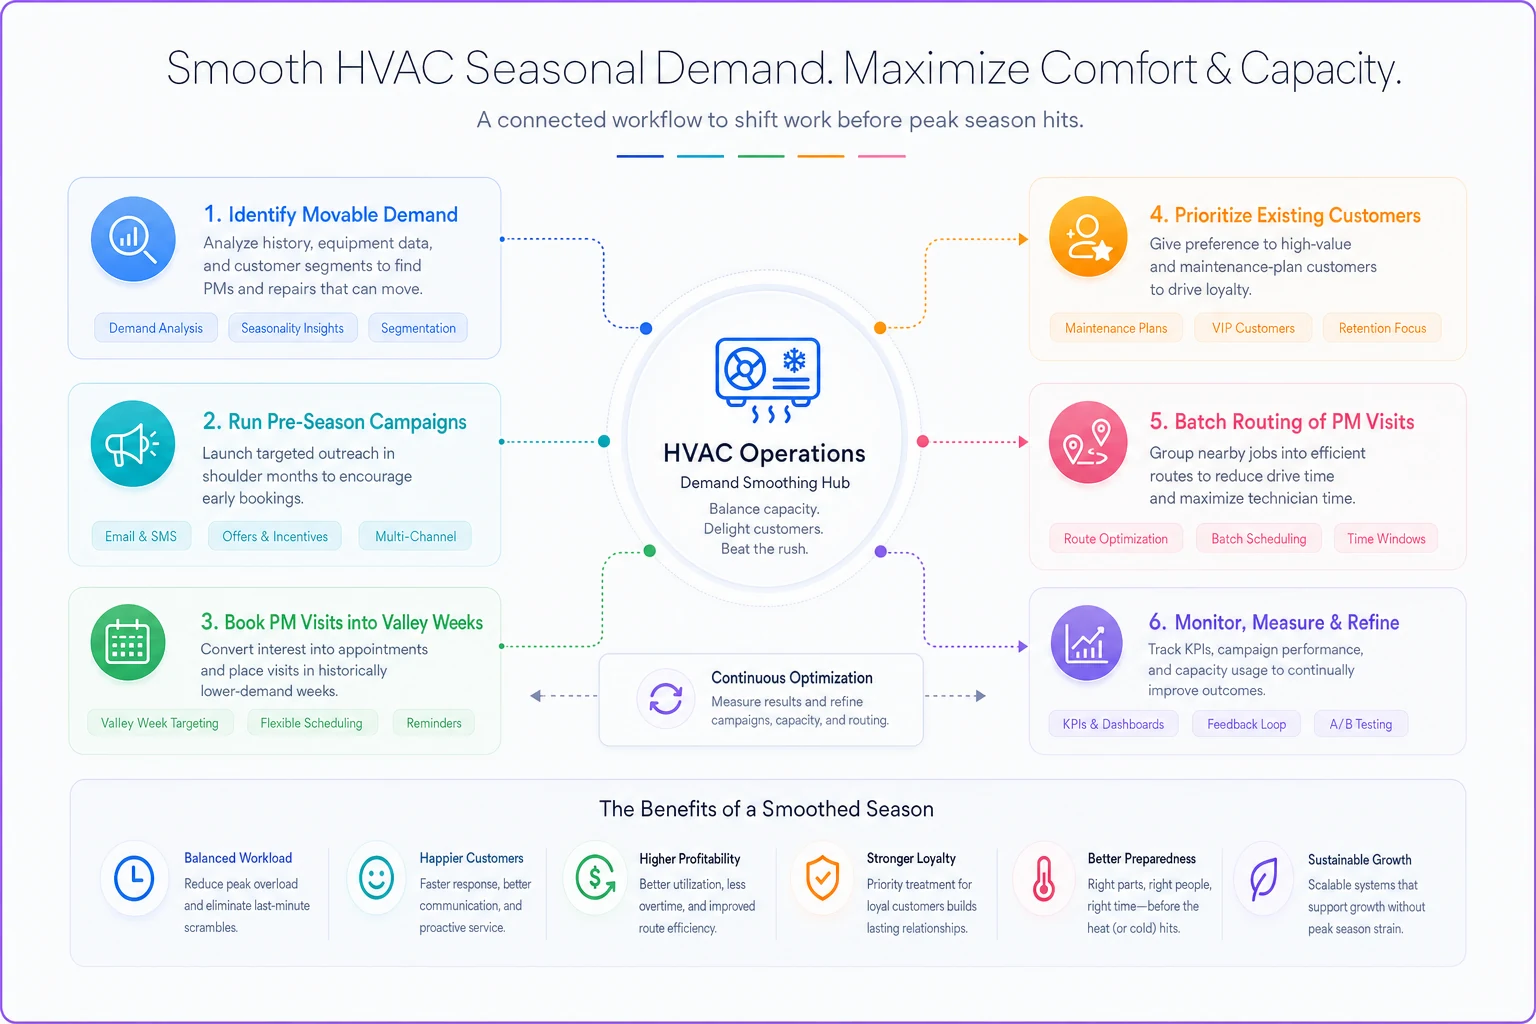
The workflow above summarizes the sequencing and decision points for front-loading maintenance and shifting load into shoulder months.
A shop doing this well can shift 15–25% of peak-season maintenance load into the shoulder months. That's often the difference between needing four temps and needing one.
There's a routing angle here too — batching those pre-season PM visits geographically keeps cost-per-visit down while you're smoothing the curve. The same batching rules and buffer math for multi-stop days that help in peak season apply even more when you're deliberately front-loading maintenance work.
Surge-staffing decision rules that keep you out of panic mode
When the surge hits — and it will, even with smoothing — you want rules already written, not decisions made at 4pm on a 98-degree Tuesday.
Pre-decide these triggers before the season starts:
-
When the 14-day forecast shows 4+ days above your local threshold → put contractors on standby, confirm temp availability, notify core team OT may be needed.
-
When same-day booking backlog exceeds one full day → activate overtime for the core crew, capped at a set daily hour limit.
-
When backlog exceeds two days for three straight days → bring in standby contractors, shift non-urgent PM visits out.
-
When callback rate rises above your baseline during a surge → that's your signal you're pushing fatigue too hard. Add bodies instead of more hours.
The cap matters. Set a maximum OT ceiling per tech per week — something like 10–12 hours — and hold it. Beyond that, you're buying fatigue, callbacks, and resentment, not real output. When you hit the cap and still have backlog, that's the temp/contractor signal, not "push harder."
Writing these rules in April means the decision is already made when it actually counts. No deliberating at the end of a long Tuesday when everyone's running hot.
A real scenario
A residential HVAC shop in a hot-summer market — seven techs, roughly $2.1M in annual revenue. Their July payroll ran about 28% over non-peak months, almost entirely overtime. Callback rate in peak weeks was running noticeably above their winter baseline. The owner figured it was just the cost of summer.
They did three things ahead of the next season. First, they pulled three years of weekly call data and mapped it against cooling degree days — gave them a reliable 9-day early warning on demand spikes. Second, they ran a spring tune-up campaign to their maintenance base and scheduled around 130 of those visits into historically slower shoulder and valley weeks. Third, they lined up two contractors in April instead of scrambling in June.
The following summer, peak overtime dropped by a little over half. Total seasonal labor cost came down roughly $22k–$26k compared to the prior year, even after paying the contractors, because they weren't stacking time-and-a-half on a full crew for weeks at a stretch. Callbacks in peak weeks came back toward their normal baseline. The core techs weren't running on fumes by August.
Nothing exotic happened. They stopped reacting and started planning against numbers they already had.
When this playbook is a bad idea
Honesty matters here — this isn't for everyone.
-
If you're a two-truck shop, the forecasting overhead probably isn't worth it. You can feel your capacity in real time and OT is genuinely your simplest lever.
-
If your demand is genuinely flat — commercial-contract-heavy with steady year-round work — you don't have a seasonal problem to solve. Different playbook entirely.
-
If your data is a mess — no clean dispatch history, bookings scattered across a notebook and three phones — fix the data capture first. You can't forecast off records you don't have.
You can't forecast off records you don't have.
Pulling it together
Seasonal overload isn't a labor problem you solve by working harder in July. It's a planning problem you solve in April.
The shops that stay profitable through the surge aren't the ones with the most techs — they're the ones who forecast the ramp with their own data, match the right staffing lever to the shape of the demand, and pull movable work out of peak weeks before it ever becomes an emergency. Overtime will always have a role for short, sharp spikes. But when you're using it to cover an entire predictable season, you're paying a premium for a problem you could have seen coming.
Get the forecast inputs in front of you, write the surge rules before the heat hits, and smooth what you can control. The margin you save is the one you were quietly bleeding without realizing it.
Seasonal overload isn't a labor problem you solve by working harder in July. It's a planning problem you solve in April.
The shops that stay profitable through the surge aren't the ones with the most techs — they're the ones who forecast the ramp with their own data, match the right staffing lever to the shape of the demand, and pull movable work out of peak weeks before it ever becomes an emergency. Overtime will always have a role for short, sharp spikes. But when you're using it to cover an entire predictable season, you're paying a premium for a problem you could have seen coming.
Get the forecast inputs in front of you, write the surge rules before the heat hits, and smooth what you can control. The margin you save is the one you were quietly bleeding without realizing it.
Ready to optimize your HVAC operations?
Join hundreds of HVAC businesses using Coolyly to save time, improve technician utilization, and enhance customer satisfaction.