



Two of your zip codes pull in roughly the same monthly revenue. One prints money. The other barely clears cost. Most HVAC owners never catch this because revenue looks fine on the dashboard and the P&L doesn't break down by geography. The damage hides in drive time, job mix, and how often your trucks actually fill their day in that area.
A territory profitability HVAC heatmap surfaces this. Not a fancy BI project — a practical map that colors your service area by margin per booked hour, then feeds a small set of triage rules: reprice here, offload there, open a hub over there. That's the whole game. Here's how to build it and, more importantly, what to do once you can see the colors.
The pattern that drives this: three variables, not one
When a zone looks profitable on paper but drains the business, it's almost always the interaction of three things.
Drive time. The silent margin killer. A 55-minute average windshield time to a cluster of homes means your tech burns close to two unbillable hours round-trip per job. At a loaded cost of roughly $65–$85 per tech-hour, that's $130–$170 of cost before anyone touches a condenser. Two of those a day and you've eaten a service call's entire margin.
Job mix. A zone full of tune-ups and warranty callbacks behaves nothing like a zone full of system replacements and billable diagnostics. Same drive time, totally different economics. A replacement-heavy suburb absorbs long drives because the ticket is $6k–$12k. A tune-up-heavy exurb at the same distance bleeds you dry.
Fill rate. How tightly can you pack a tech's day in that area? Dense zones let you batch four to six stops. Sparse rural zones strand a tech with two jobs and dead space between them. Low fill rate means you're paying for idle hours and calling it "coverage."
The mistake owners make is optimizing one of these in isolation. They'll chase a far-out zone because "the tickets are big" without noticing fill rate there is so low the tech only lands one job per trip. Or they'll defend a close-in neighborhood that's all $89 tune-ups and callbacks because "it's five minutes away" — ignoring that the job mix guarantees thin margins no matter how short the drive.
You need all three layered on one map. That's what makes a heatmap worth building instead of just another report nobody acts on.
What the heatmap actually measures
Forget coloring by revenue. Color by margin per booked hour at the zone level — zip code, or better, a cluster of a few thousand households. The formula is straightforward:
Eliminate scheduling chaos and missed jobs.
Coolyly helps HVAC companies book, coordinate, and track every service efficiently.
- Unified appointment & dispatch management
- Automated client notifications
- Technician scheduling & job tracking
No credit card required
> Zone margin per booked hour = (Revenue − parts − labor − allocated drive cost − allocated overhead) ÷ total booked technician hours in the zone
If you don't already have a clean cost-to-serve foundation, build that first — your heatmap is only as honest as the cost model feeding it. The approach in building an HVAC cost-to-serve model and month-end job-margin reconciliation gives you the per-job cost math this map depends on. Without it, you're coloring zones by gut feel and the whole exercise is cosmetic.
Here's a sample of what the zone table behind the heatmap looks like once populated:
| Zone | Avg drive time | Job mix (dominant) | Fill rate | Margin / booked hr | Triage flag |
|---|---|---|---|---|---|
| North Ridge | 18 min | Replacement + diag | 82% | $94 | Keep / grow |
| Elmwood | 22 min | Mixed service | 71% | $61 | Watch |
| Cedar Flats | 41 min | Tune-up heavy | 44% | $19 | Reprice or offload |
| Harvest Mill | 52 min | Replacement | 38% | $44 | Hub candidate |
| Old Town | 12 min | Callback heavy | 68% | $27 | Reprice + fix FTFR |
Two things jump out that a straight revenue report would hide. Cedar Flats and Old Town both look "fine" on revenue — but one is far with bad mix, the other is close with a quality problem. Completely different fixes. And Harvest Mill is far with terrible fill rate, yet the job mix is strong enough that it's not a kill candidate — it's a hub candidate. Same color on a naive map, opposite interventions.
Turning the map into triage rules
The heatmap's only job is to route each zone into one of a few actions. Keep the rule set small — five or fewer — or your dispatchers will ignore it after the first week.
-
Margin/hr above target + good fill rate → Grow. Push marketing spend and PM enrollment here. This is where you want more density, not less.
-
Low margin/hr + short drive + bad job mix → Reprice or fix quality. The distance isn't the problem. Either your pricing doesn't match the work, or callbacks are eating the zone. Old Town in the example above is a quality fix, not a pricing fix — repricing a callback problem just makes customers angrier.
-
Low margin/hr + long drive + low fill rate + weak mix → Offload or minimum-charge. Stop subsidizing it. Either impose a travel surcharge or trip minimum, hand it to a partner, or restrict to specific days only.
-
Strong mix + long drive + low fill rate → Hub candidate. The economics are good enough that fixing the drive-time problem with a satellite hub or a pre-staged van unlocks real margin.
-
Everything in the middle → Watch. Don't act yet. Re-evaluate next quarter. Most zones live here and that's fine.
The rule most owners get wrong is #3 versus #4. A far-away zone with bad margins feels like something to cut. But if the job mix is replacement-heavy, cutting it means handing competitors your best tickets. The differentiator is job mix, not distance. Distance tells you how to serve it; mix tells you whether to.
The three interventions, in detail
Reprice: travel-adjusted pricing by zone
The cleanest lever for close-in-but-thin and far-but-decent zones. You're not raising prices everywhere — you're adding a distance tier or trip minimum that only triggers past a drive-time threshold.
A typical rollout: zones beyond 35 minutes get a trip charge somewhere in the $45–$75 range, or a service-call minimum that reflects the real windshield cost. In practice, maybe a quarter of customers in those zones push back, a few cancel, and the ones who stay are now actually profitable. The zone's margin/hr climbs not because you did more jobs, but because you stopped doing unprofitable ones.
When this makes sense: short-drive, bad-mix zones where quality is fine, and far zones with acceptable fill rate. When it's a bad idea: zones where a competitor is five minutes closer and your repricing just hands them the territory.
Offload: minimums, restricted days, or partners
Some zones shouldn't be served on demand at all. Restricting a sparse rural zone to Tuesdays and Thursdays instantly improves fill rate — you batch every job in that area into two days instead of sending a lone truck whenever a call comes in.
This ties directly to how you build the day. The batching logic in route planning for multi-stop residential service days is what makes restricted-day offloading work — you're clustering the sparse zone's jobs into tight routes instead of letting them scatter across the week and wreck utilization.
One caveat: anyone with a commercial SLA in that zone should not do this. Restricted days break contractual response windows fast.
Open a hub: for strong-mix, far, low-fill zones
The heavy intervention, and the one owners jump to too early. A hub only pays off when a far zone has enough strong-mix volume to justify pre-staged parts, a dedicated van, or a small satellite location.
Rough math before you commit: if a zone like Harvest Mill generates around 25–35 jobs a month at replacement-level tickets, and the drive is killing roughly 1.5 hours per job, a pre-staged van parked closer two days a week can recover 30–40 hours of windshield time monthly. At loaded cost, that's real money — but only because the ticket size justifies the overhead. Run the same play in a tune-up zone and the hub cost swamps the savings pretty quickly.
A pilot template you can run in 30 days
Don't rebuild your whole territory map and roll out five interventions at once. Pilot one zone, one intervention.
-
Pick one flagged zone — ideally a clear reprice or offload candidate, not a hub (hubs take longer to prove out).
-
Set a single success metric margin per booked hour for that zone, measured before and after.
-
Baseline it using the last 60–90 days of job data so you're not comparing against a fluke month.
-
Apply one intervention — a trip charge, or restricted days. Not both.
-
Run it 30 days, communicate the change to customers in that zone plainly, and track cancellations alongside margin.
-
Check FTFR and callback impact — make sure you didn't trade margin for angry customers or rework that eats the gain.
-
Decide
keep, adjust, or revert.
Then move to the next zone.
The pilot discipline matters because the first number owners look at — cancellations — always spikes a little and panics people. The number that actually matters is margin per booked hour net of those cancellations. Usually it's up even with a few lost jobs, because the lost jobs were the unprofitable ones.
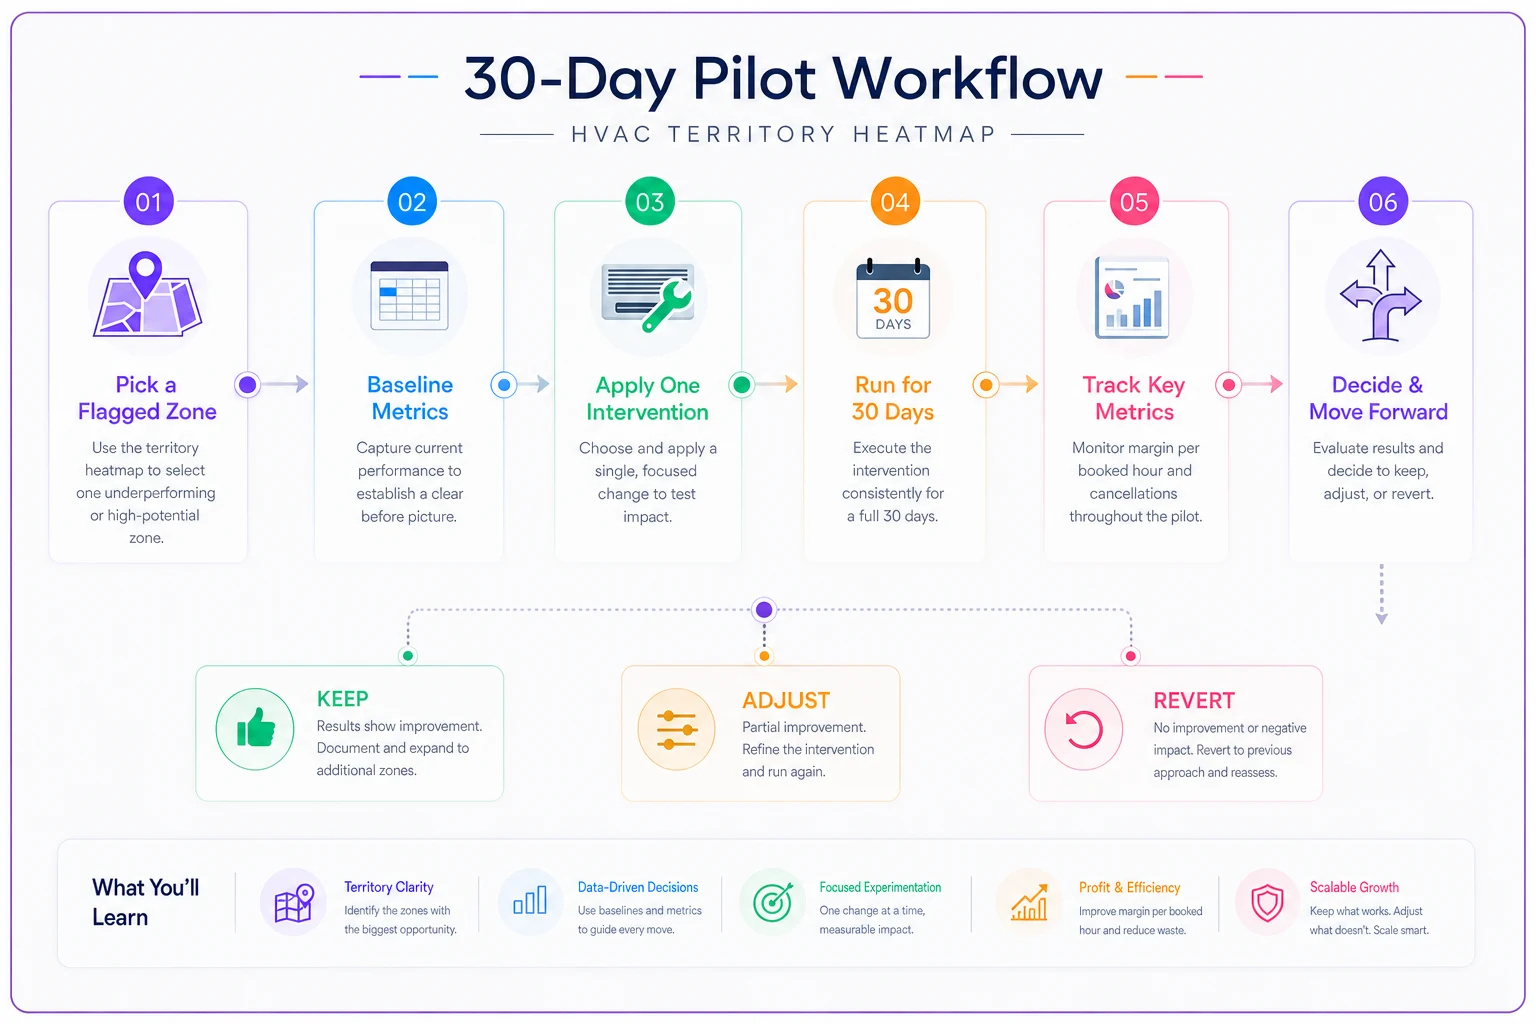
A simple flowchart showing the pilot steps helps the team follow the discipline.
A real scenario
A residential HVAC shop running six trucks had a rural cluster everyone assumed was performing fine — steady calls, decent revenue, roughly $6k–$7k monthly out of that area. The heatmap told a different story: 48-minute average drive, fill rate around 40%, mostly tune-ups and small repairs. Margin per booked hour sat near $20 against a company target of $70.
They didn't cut the zone. They offloaded it to restricted service — Tuesdays and Thursdays only — and added a $55 trip minimum. Two regulars pushed back and one left. But the remaining jobs now batched into tight two-day routes, and the trip charge covered the windshield cost. Margin per booked hour in that zone moved from the low $20s to around $55 over the following two months. Similar revenue, very different profit.
The owner's reaction was something like: "I would've bet that zone was healthy." That's the whole point of the map — revenue hid the problem, and the heatmap made it impossible to ignore.
Where owners go wrong with this
A few recurring mistakes worth calling out, because the map is easy to misuse:
-
Coloring by revenue instead of margin per booked hour. The single most common error. It makes busy zones look good regardless of profit.
-
Acting on every yellow zone. Most zones belong in "watch." Churning pricing across the whole map annoys customers and teaches nothing.
-
Treating distance as the only villain. Job mix changes the verdict completely. Far isn't automatically bad.
-
Jumping to hubs. It's the exciting intervention, so people reach for it first. It's almost always the wrong first move. Reprice and offload prove themselves in weeks; hubs take a quarter and real capital.
-
Not re-running the map seasonally. Job mix shifts hard between cooling and heating season. A zone that's replacement-heavy in July can go callback-heavy in January.
Each of these mistakes shares a common thread: they're reactions to surface-level numbers. The map is only useful if you're feeding it the right cost data and reading the job mix alongside drive time, not instead of it.
Keeping the map alive
The heatmap isn't a one-time exercise you frame on the wall. The useful version refreshes monthly off the same job data you're already reconciling at month-end, and the triage flags update as drive times, fill rates, and mix shift.
The zones that matter most are the ones that move between quarters — a watch zone sliding toward reprice, a hub candidate whose volume finally crossed the threshold.
Automate the monthly refresh and highlight zones that change triage status by more than one band so managers can prioritize reviews.
Most HVAC shops are subsidizing two or three zones they'd never guess at — and the map is the fastest way to find out which ones.
Build it honest, keep the rule set small, pilot one intervention at a time, and let the colors tell you where your margin is actually hiding.
Ready to optimize your HVAC operations?
Join hundreds of HVAC businesses using Coolyly to save time, improve technician utilization, and enhance customer satisfaction.