



Most HVAC shops can tell you their revenue down to the dollar. Ask them which jobs made money last month and you get a shrug, a gut feeling, or worse, confidence that turns out to be wrong. The maintenance contract everyone loves? Might be barely breaking even once you load in drive time and the callback rate. The big commercial install everyone's proud of? Could be underwater because nobody tracked the three return trips for parts.
The problem isn't that owners don't care about margin. It's that the accounting system and the field system speak two different languages with nobody translating between them. Your dispatch software knows the job took 4.5 hours and used a blower motor. QuickBooks knows you spent money on payroll and parts. Neither system connects those two facts at the job level. So you end up with a healthy-looking P&L and no real idea which parts of the operation are subsidizing the rest.
This is the whole point of HVAC cost-to-serve job margin work—getting to where you can look at any completed job and know, within a reasonable range, what it actually cost you to show up and finish it. Not company-wide averages. The actual per-job number. Once you have that, pricing decisions, offload decisions, even hiring decisions stop being guesses.
Why company-level profitability hides everything that matters
Here's the trap almost every shop falls into. You run a decent net margin—say 9-12%—and assume the business is basically healthy. But a company average is just a blended number sitting on top of enormous variation. In real operations the spread tends to look something like this: roughly 30% of your jobs running strong margins, 40% doing okay, and the bottom 30% either flat or quietly losing money. The winners carry the losers, and because it all nets out to a fine bottom line, nobody goes looking.
The variation gets worse as you add job types. A residential diagnostic call, a warranty return, a PM visit, and a rooftop unit replacement have completely different cost structures—drive time, tech skill level, truck stock consumption, callback probability. When you price everything off flat-rate books or instinct without knowing your true cost-to-serve by category, you're guessing which work subsidizes what.
And the categories losing money are almost never the ones owners suspect. The quiet killers tend to be the "small" jobs—the $180 no-cool diagnostics that take a 45-minute drive each way, or the goodwill callbacks that never get costed at all. Nobody flags a $180 ticket as a problem. But twelve of them a week with two hours of unbilled drive time each? That's a real hole.
What "cost to serve" actually needs to include
If you're going to build this properly, the model has to capture everything that touches a job—not just the obvious labor and materials. The stuff people forget is exactly where margin hides.
Eliminate scheduling chaos and missed jobs.
Coolyly helps HVAC companies book, coordinate, and track every service efficiently.
- Unified appointment & dispatch management
- Automated client notifications
- Technician scheduling & job tracking
No credit card required
-
Direct labor — fully loaded, not just wage. Add payroll tax, workers' comp, benefits, and PTO accrual. A $28/hr tech usually costs closer to $40-45/hr loaded.
-
Drive time and windshield cost — the tech's loaded rate during travel plus fuel and vehicle wear. This is the single most under-counted cost in the trade.
-
Parts and materials — at real cost, including what gets consumed off the truck (fittings, refrigerant, consumables) that never makes it onto the invoice.
-
Truck and equipment allocation — a per-job share of vehicle payment, insurance, maintenance, and tooling.
-
Dispatch and admin overhead — the office time to book, schedule, invoice, and collect. Roughly a fixed per-job amount you can estimate.
-
Callback/warranty reserve — a probability-weighted cost. If a job type has a 6% callback rate and each callback costs around $130, you load about $8 into every job of that type.
That last one trips people up. You don't wait for a callback to happen before costing it—you build the expected callback cost into every job in that category based on history. Same logic insurers use, applied to your own warranty exposure.
You don't wait for a callback to happen before costing it—you build the expected callback cost into every job in that category based on history. Same logic insurers use, applied to your own warranty exposure.
Building the job-level costing template
You don't need enterprise software to start. A structured template gets you most of the way there, and building it by hand first actually teaches you what your real cost drivers are before you automate anything.
Here's a simplified version of what a per-job cost model looks like:
| Cost component | How to calculate | Example (residential AC repair) |
|---|---|---|
| Loaded labor | Loaded rate × on-site hours | $42/hr × 2.0 hrs = $84 |
| Drive time | Loaded rate × travel hours | $42/hr × 0.75 hrs = $31.50 |
| Fuel/vehicle | Miles × per-mile cost | 22 mi × $0.62 = $13.64 |
| Parts (true cost) | Sum of parts + truck consumables | $95 + $12 = $107 |
| Dispatch/admin | Fixed per-job estimate | $18 |
| Callback reserve | Callback rate × avg callback cost | 5% × $130 = $6.50 |
| Total cost to serve | ~$260.64 | |
| Invoice price | $389 | |
| Job margin | Price − cost | ~$128 (33%) |
Now run that same math on your diagnostic-only calls, PM visits, and install jobs. Once you see the categories side by side, things click fast. You'll almost always find at least one category you assumed was profitable sitting at single-digit margin once drive time and callback reserve are loaded in.
The key is consistency. Every job type gets costed the same way, every month, so the numbers are actually comparable over time. If you're still setting prices off instinct, this pairs directly with tightening up your pricing structure—which we covered in detail in the flat-rate estimate and job-type library breakdown. The cost model tells you the floor; the flat-rate library tells you what to charge above it.
The part nobody wants to do: mapping dispatch fields to GL codes
This is where most cost-to-serve projects die. You've got a costing template, but the raw data lives in two disconnected systems and reconciling them by hand every month is genuinely miserable. The fix is a defined mapping between the fields your field system captures and the general ledger accounts your books use.
Think of it as a translation table. Your work order has fields like job type, on-site duration, parts used, tech assigned, and travel distance. Your GL has accounts like direct labor, COGS-parts, vehicle expense, and overhead allocation. Month-end reconciliation is the process of pushing field data into the right GL buckets and checking that the totals agree.
-
Pull completed jobs for the period from dispatch, with all cost fields populated.
-
Map each field to its GL account using your defined crosswalk (on-site + drive hours → direct labor; parts → COGS; miles → vehicle expense).
-
Aggregate field-derived costs by category and compare to actual GL totals for the same period.
-
Calculate the variance between what your job costing says you spent and what the books actually say.
-
Investigate anything outside your variance threshold (more on that below).
-
Lock the period and roll job-level margins into your reporting.
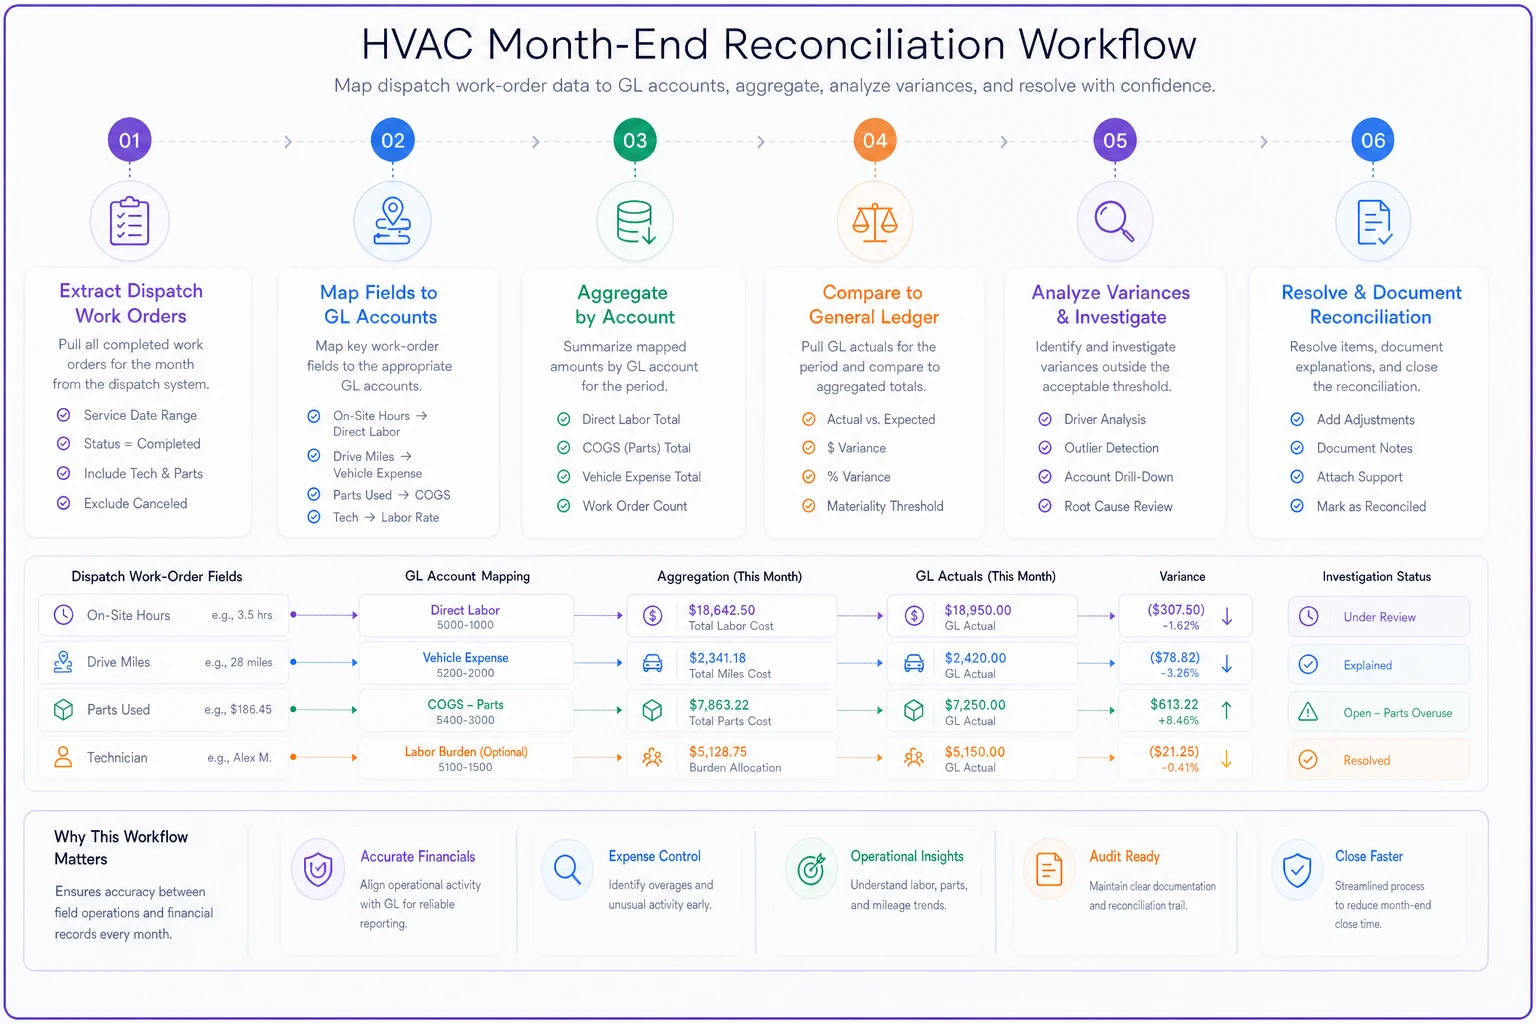
Step 3 matters a lot. If your job-costed labor says $84k but payroll actually ran $97k, that $13k gap is unallocated cost—time your techs got paid for that never landed on a job. Shop time, no-shows, excessive travel, whatever the cause. It's real money and it's invisible until you reconcile. Chasing that gap down month over month is one of the higher-ROI habits an operations manager can build.
Chasing that gap down month over month is one of the higher-ROI habits an operations manager can build.
Variance thresholds: knowing when to actually care
Reconciliation is only useful if you know which gaps to chase and which to leave alone. Not every variance is worth an hour of investigation—this is where thresholds matter.
-
Labor variance — investigate anything over ±5% between costed and actual.
-
Parts/COGS variance — tighter, ±3%, because parts should reconcile closely.
-
Vehicle/travel variance — looser, ±8%, since mileage estimates are inherently approximate.
-
Unallocated labor — flag if it exceeds roughly 10% of total labor. Above that, you've got a real productivity or time-capture problem.
The point of thresholds isn't precision for its own sake. It's to keep month-end from turning into a witch hunt over $40 discrepancies while a $12k unallocated-labor problem sits there ignored. Shops without thresholds either reconcile obsessively and burn out, or give up entirely. The band keeps you honest without wasting your time.
Start with these bands and tighten them quarterly as your time-capture and parts reconciliation improve.
One pattern worth watching: if a specific job type consistently blows its labor variance—actual always running higher than costed—your standard time estimate for that job is wrong. That's not an accounting problem, it's an estimating problem, and it means you've been underpricing that category the whole time.
Turning margins into pricing and offload decisions
The whole reason to build this is to make better decisions, not to admire spreadsheets. Once you've got clean job-level margins across categories, you can set decision rules that take the emotion out of pricing and capacity planning.
-
Any job category below roughly 15% margin gets a price review, not an automatic price hike—sometimes it's a routing or callback problem, not a pricing one.
-
Categories that stay below single digits after two review cycles are candidates to offload—raise the price aggressively and let the market decide, or stop marketing that service.
-
High-drive-time, low-ticket jobs get zone-based minimums. If a $180 diagnostic 30 minutes out can't clear cost, you either add a trip charge or stop taking those bookings during peak season.
-
PM contracts get re-priced against their true loaded cost annually, including the callback and drive load, not just the parts.
The offload nuance people miss: "offloading" doesn't always mean firing a customer. Often it means pricing a category so it either becomes profitable or naturally shrinks. If your money-losing small diagnostics get a trip fee and half the callers still book, you just fixed the margin. If they all disappear, you freed up capacity for work that pays. Either outcome is a win—and you only know which lever to pull because the cost model told you where the floor was.
This also feeds directly into capacity planning. When you know margin by job type, you can protect your highest-margin work during peak demand instead of filling the schedule first-come-first-served and burning your best techs on break-even calls.
When this makes sense—and when it doesn't
This is worth building when you're running more than a few trucks, your job mix has real variety (residential plus commercial, service plus install plus PM), or your bottom line looks fine but you can't explain why month to month. At that scale the blended average is actively misleading you, and a cost-to-serve model is the only way to see through it.
This is probably overkill when you're a one- or two-truck shop doing mostly one type of work. Your variation is low enough that gut feel plus a decent flat-rate book gets you close. Build the habit of tracking drive time and callbacks now, but don't build a full reconciliation system yet.
Who should not bother: anyone who won't commit to the month-end habit. A cost-to-serve model you build once and never reconcile is worse than none—it gives you false confidence in stale numbers. This is a monthly discipline, not a one-time project.
A real scenario
A regional shop running eight trucks—mixed residential service and light commercial—had a solid-looking year, around 10% net. But cash always felt tighter than the P&L suggested. When they finally built job-level costing and ran three months of reconciliation, two things came out.
First, unallocated labor was running close to 14% of total labor. Techs were getting paid for a lot of time that never hit a job—slow shop mornings and long unbilled drives on scattered routes. Second, their residential diagnostic category was running about 4% margin once drive time and a 7% callback rate were loaded in. They'd assumed it was a healthy lead-in to bigger work; sometimes it was, but a large chunk were dead-end calls that cost more than they returned.
They didn't do anything dramatic. They added a modest trip charge in outer zones, tightened routing to cut windshield time, and re-priced two PM tiers that were quietly underwater. Over the following quarter, net margin moved into the 13-14% range and the cash pressure eased. Revenue didn't change much—they just stopped subsidizing the losers.
Making it sustainable
The manual version proves the concept, but doing this by hand every month gets old fast, and that's exactly when shops abandon it. The realistic path is letting your operational platform capture cost fields at the source—drive time, on-site duration, parts consumed, callback flags—so the data is clean before it ever reaches reconciliation. AI-assisted operational software can handle the tedious middle work: mapping work-order fields to GL codes automatically, flagging variances that breach your thresholds, surfacing job categories drifting below your margin floor without anyone building a fresh spreadsheet each month. The goal isn't to replace judgment—it's to make sure the numbers are trustworthy and current when you sit down to make pricing calls.
The reconciliation discipline also connects to the rest of your reporting. Job-level margin data is one of the most valuable inputs for leadership decisions, which is why it belongs alongside the other operational metrics covered in the role-based leadership KPI dashboard breakdown. And when you're deciding which service lines to grow, margin-by-category data pairs naturally with the recurring-revenue thinking behind a data-driven preventive maintenance program—because a PM program is only worth scaling once you know its true cost to serve.
The shops that pull ahead aren't the ones with the highest revenue. They're the ones who know, job by job, where the money actually comes from—and have the discipline to price and route accordingly. That knowledge doesn't come from your P&L. It comes from the unglamorous work of connecting the field to the ledger, one reconciled month at a time.
Ready to optimize your HVAC operations?
Join hundreds of HVAC businesses using Coolyly to save time, improve technician utilization, and enhance customer satisfaction.