
Most HVAC operations dashboards end up full of vanity metrics nobody uses. Revenue per tech, call volume trends, average ticket size—numbers that look good in Monday meetings but don't actually tell you whether to hire another tech, split a territory, or have a serious conversation with your dispatcher.
The real problem isn't tracking metrics. It's that most HVAC companies track dispatch in one place, PM contract performance somewhere else, sales conversion in a spreadsheet, and financials in QuickBooks. Leadership then spends hours every week trying to piece together what's actually happening.
What you need is a unified KPI taxonomy—where dispatch efficiency connects to territory performance, which connects to hiring triggers, which connects to financial thresholds. Not just numbers on screens, but decision gates that tell you exactly when to act.
The governance problem
In most growing HVAC companies, the owner checks revenue and margins, the service manager watches completion rates and callbacks, dispatch tracks response times, and sales monitors leads. Everyone's optimizing their own area without seeing how their decisions ripple through the whole operation.
Territory decisions are a good example. Your top tech in the north territory hits 8 calls a day with a $687 average ticket. Looks great. But zoom out—that territory generates 47% of your callbacks because he's rushing through installs. Meanwhile, your south territory tech averages 5 calls at $892 per ticket with almost no callbacks. Without unified metrics, you'd probably push the first tech harder and wonder why customer retention tanks six months later.
The governance piece matters because different roles need different visibility. Your dispatcher doesn't need to see profit margins on every call, but they absolutely need to know when a territory is hitting capacity. Your service manager needs callback patterns tied to specific techs and job types. Ownership needs to see when operational stress in one area is about to crater profitability somewhere else.
Role-based templates that match operational reality
Dispatch Manager Dashboard
Eliminate scheduling chaos and missed jobs.
Coolyly helps HVAC companies book, coordinate, and track every service efficiently.
- Unified appointment & dispatch management
- Automated client notifications
- Technician scheduling & job tracking
No credit card required
-
Current day completion probability by territory
-
Tech utilization vs. callback risk scores
-
Parts availability impact on schedule
-
Territory balance indicators
-
Next-day prebooking capacity
Service Manager Dashboard
-
Tech performance matrix (speed vs. quality vs. revenue)
-
Callback patterns by tech, job type, and territory
-
Training effectiveness scores
-
Customer satisfaction trends by crew
-
Equipment failure pattern recognition
Financial Leadership Dashboard
-
Territory profitability including drive time costs
-
Customer lifetime value by acquisition source
-
Tech efficiency impact on gross margins
-
PM contract performance
-
Working capital requirements by growth scenario
Sales Manager Dashboard
-
Lead response time impact on close rates
-
Territory penetration vs. potential
-
Upsell success by tech and job type
-
Quote-to-close aging patterns
-
New vs. existing customer revenue mix
Make these dashboards different views of the same dataset so actions in one area update related views automatically.
What makes this actually work is that these aren't separate dashboards—they're different views of the same underlying data. When dispatch decisions affect callback rates, it flows into financial projections. When sales targets shift, capacity planning adjusts. One connected system.
Decision gates that trigger real actions
This is where things get useful. Not alerts that everyone ignores, but actual decision gates that force action.
Hiring Decision Gate
-
Territory density exceeds 12 calls per day for 3 consecutive weeks
-
Average response time crosses 4 hours
-
Overtime costs exceed 15% of territory labor
-
Customer acquisition cost drops below $127
Territory Split Decision Gate
-
Drive time exceeds 23% of billable hours
-
Territory generates over $165k monthly for 2 quarters
-
Customer density hits 430+ active addresses
-
Tech utilization drops below 68% due to windshield time
Pricing Adjustment Gate
-
Booking rate exceeds 87% capacity for 6 weeks
-
Lead conversion drops below 31%
-
Competitor pricing delta exceeds 15%
-
Gross margin variance hits ±4% from target
Service Expansion Gate
-
PM contract renewal rate above 78%
-
Install callback rate under 3.4%
-
Tech capability scores over 8.2/10
-
Market penetration below 12% in adjacent territory
These aren't suggestions—they're operational rules. When conditions are met, the action items surface on the right dashboard with clear next steps.
Drill-down paths that reveal root causes
Surface-level KPIs hide the real problems. Your average ticket might be $567, but that tells you nothing about why it isn't $750. You need drill-down paths that expose the actual drivers.
Average Ticket → Service Type → Tech Performance → Time of Day → Customer Type
Following that path might reveal that residential maintenance calls before noon average $432, while emergency calls after 5pm average $891. But go deeper—those evening emergency calls also generate three times more negative reviews because customers are already frustrated before the tech even arrives. High ticket, hidden reputation cost.
Another path worth building:
Territory Revenue → Customer Density → Service Mix → Tech Allocation → Drive Time Impact
This might show your highest revenue territory actually has the worst margins because windshield time kills efficiency. The fix isn't more calls—it's restructuring the territory or adjusting scheduling logic.
The finance integration most companies get wrong
Most HVAC companies treat operational KPIs and financial metrics as completely separate. Your P&L shows labor at 34% of revenue, but that doesn't tell you whether the issue is tech efficiency, pricing, or territory design.
| Operational Metric | Financial Impact | Decision Point |
|---|---|---|
| Callback rate +1% | Gross margin -2.3% | Review training program |
| Response time +30min | Customer LTV -$340 | Add capacity or adjust zones |
| First-call completion -5% | Parts carrying cost +$12k/quarter | Revise truck stock strategy |
| PM renewal rate -10% | Revenue predictability -18% | Audit service delivery quality |
| Tech overtime +5 hrs/week | Profit margin -1.7% | Trigger hiring evaluation |
Connect these two worlds and you can actually see the business impact of operational decisions. That new tech who looks expensive at $72k might pay for himself inside a year by reducing overtime and improving territory coverage. You won't know that without the connection.
Building the decision framework
Start with outcome metrics and work backward to drivers. If your goal is 42% gross margin, what operational levers actually affect that number?
-
Labor efficiency (routing, skill matching, callback rates)
-
Parts margin (truck stock, supplier terms, waste)
-
Pricing realization (tech confidence, estimate accuracy, competition)
-
Customer mix (marketing, territory selection, service offerings)
Each of these breaks down further into measurable KPIs someone can actually influence. Your dispatcher can't control gross margin directly, but they can absolutely impact labor efficiency through better routing and schedule optimization.
Warning signs your KPI system isn't working
The Monday Morning Scramble — If leadership spends the first couple hours of every week figuring out what happened last week, your KPIs aren't unified. Information should flow automatically into decision-ready formats.
The Blame Game — When problems surface, teams point fingers because nobody can see how their actions affect other departments. Unified KPIs make cause-and-effect visible.
Optimization Islands — Dispatch celebrates record call volume while service drowns in callbacks. Sales hits targets while operations struggles. This happens when KPIs aren't connected across functions.
Analysis Paralysis — You track 200 metrics but can't answer basic questions like "should we hire?" or "is this territory profitable?" More data isn't better. Connected data is better.
Territory optimization through connected metrics
Territory decisions usually default to geographic boundaries and tech home addresses. But smarter territory design requires pulling multiple data streams together:
-
Customer density and service demand patterns
-
Tech skill distribution and certification requirements
-
Equipment age and failure probability
-
Seasonal demand fluctuations
-
Competition density and pricing pressure
When these feed into unified HVAC operations dashboard KPIs, territory adjustments become data-driven rather than reactive. You'll spot when a territory is about to tip from profitable to problematic before it shows up in customer satisfaction scores.
One mid-sized HVAC company in Phoenix found their east territory generated 31% more revenue but 18% lower margins than their west territory. Digging in, the east had newer construction requiring mostly installs—lower margin, longer jobs—while the west had aging systems needing repairs and replacements, which turn faster at better margins. They adjusted tech allocation and pricing accordingly and improved overall profitability by roughly $23k per month.
The implementation sequence that works
Don't try to build the perfect KPI system overnight.
Phase 1: Core Operations (Weeks 1–4)
-
Unify dispatch, completion, and callback metrics
-
Create basic role-based views
-
Establish daily operational rhythm
Phase 2: Financial Integration (Weeks 5–8)
-
Connect labor costs to operational metrics
-
Add margin analysis by service type
-
Build profitability views by territory and tech
Phase 3: Predictive Indicators (Weeks 9–12)
-
Add capacity planning metrics
-
Create demand forecasting models
-
Build early warning systems
Phase 4: Advanced Optimization (Weeks 13–16)
-
Implement decision gates
-
Add competitive intelligence
-
Create scenario planning tools
Phase 5: Continuous Refinement
-
Test and adjust trigger thresholds
-
Add drill-down paths based on actual use
-
Refine role-based templates
Here's a simple implementation workflow visualization.
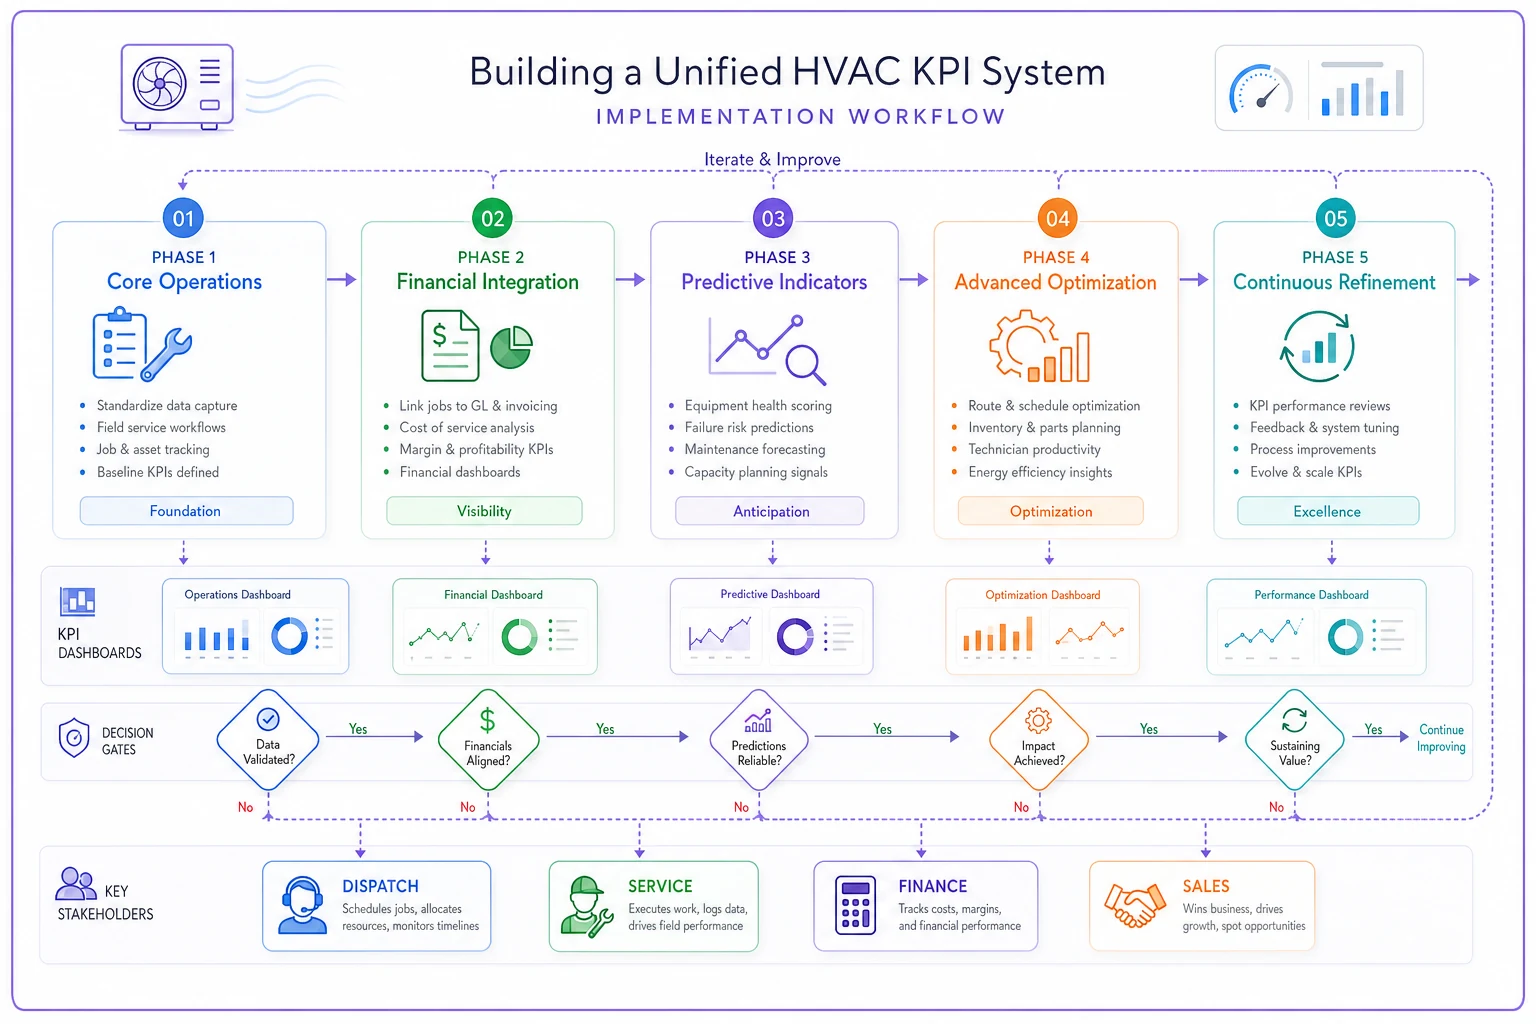
Each phase builds on the previous. You end up with something robust rather than something your team immediately stops using.
Don't let the technology define the framework
A lot of HVAC companies assume buying expensive dashboard software solves the KPI problem. It doesn't. Software without governance just creates prettier confusion.
-
Real-time data flow from field operations
-
Role-based access controls
-
Mobile accessibility for field leaders
-
Integration with existing financial systems
-
Automated alert distribution
-
Historical trend analysis
-
Export capabilities for deep dives
AI-powered operational software can accelerate this significantly—automatically identifying patterns across dispatch, service, and financial data that are easy to miss manually. These platforms can flag when territories need rebalancing or surface early indicators of tech performance issues before they reach customers. The value is in augmenting your decision-making, not replacing it.
Making KPIs drive actual decisions
The difference between vanity metrics and operational KPIs is whether they trigger specific actions. Every metric in your dashboard should answer "what now?"
Bad KPI: Customer satisfaction score: 4.2/5 Good KPI: Territory North satisfaction dropped below 4.0 threshold—review tech assignments and recent callback patterns
Bad KPI: Monthly revenue: $487,000 Good KPI: Revenue trending 12% below capacity—increase marketing spend or review pricing strategy
Bad KPI: Average response time: 3.2 hours Good KPI: Response time exceeds 3-hour SLA in 34% of calls—evaluate territory split or hiring trigger
The governance rules determine who sees what and who acts on which triggers. Your dispatcher doesn't need to know margins are slipping, but they do need to know that rushing calls to hit response times is generating expensive callbacks downstream.
Creating accountability without micromanagement
Role-based KPIs should empower teams to self-correct before leadership has to step in. When everyone can see how their actions affect broader outcomes, accountability tends to happen on its own.
A service manager watching callback rates by tech can address training gaps before they hit profitability. A dispatcher seeing territory imbalances can adjust routing before response times degrade. A sales manager tracking quote aging can follow up before leads go cold.
The governance structure should define:
-
Who owns which metrics
-
What actions they're authorized to take independently
-
When escalation is required
-
How often reviews occur
-
What counts as acceptable variance
This prevents both the "not my problem" reflex and the "everything is on fire" panic that show up constantly in growing HVAC operations.
From data chaos to operational clarity
Building unified HVAC operations dashboard KPIs isn't about tracking more numbers—it's about connecting the numbers you already have into a system that drives decisions. When dispatch metrics flow into financial projections, when territory performance triggers hiring decisions, when every role has the visibility they need to optimize their piece while still seeing the whole picture, that's when data becomes genuinely useful.
Start with one decision gate. Pick the operational choice that causes the most friction—hiring, territory splits, pricing adjustments—and build the KPI framework around making that decision cleaner. Once that works, move to the next. A few months in, you'll have shifted from reactive management to something that actually looks like proactive operations.
Leadership stops living in spreadsheets. Managers stop fighting fires. The whole organization moves from gut-feel decisions to ones backed by data that actually improves both operational efficiency and the bottom line.
Ready to optimize your HVAC operations?
Join hundreds of HVAC businesses using Coolyly to save time, improve technician utilization, and enhance customer satisfaction.