

Most HVAC companies don't fail at analytics because they lack data. They fail because they buy a reporting tool, wire it up to their dispatch system, and then nothing changes. The numbers sit there. Managers glance at them on Monday. Techs never see them. Six months later somebody asks, "Are we actually getting anything out of this?"
Usually the honest answer is no — not because the tool was bad, but because there was no ladder. No sense of what "good" looks like at each stage, who owns which number, or what has to be true before you spend on the next layer.
This framework is built the way service businesses actually grow. It ties every analytics investment to four operational KPIs that pay the bills — first-time-fix rate (FTFR), mean-time-to-repair (MTTR), parts fill-rate, and revenue-per-tech — and it puts governance roles and ROI checkpoints at each stage so you don't burn money on stage-four tooling while you're still operationally stage one.
Why analytics maturity is different from "buying a dashboard"
The gap between a company that reports numbers and a company that runs on numbers is enormous, and it has almost nothing to do with software sophistication.
A typical example: a four-truck residential shop pulls FTFR out of their field software and sees 71%. Fine. But nobody can tell you why it's 71%. Is it a diagnostic problem? A parts-availability problem? A scheduling problem where the wrong tech gets sent to the wrong job? Without that decomposition, the 71% is just a bathroom scale — it tells you you're heavy, not what to eat.
What you see across a lot of field-service operations is that maturity moves through predictable stages, and each stage unlocks the next question. You can't ask "which tech has a diagnostic gap on inverter systems" until you've first solved "do we even trust the FTFR number." Skipping stages is where the money gets wasted.
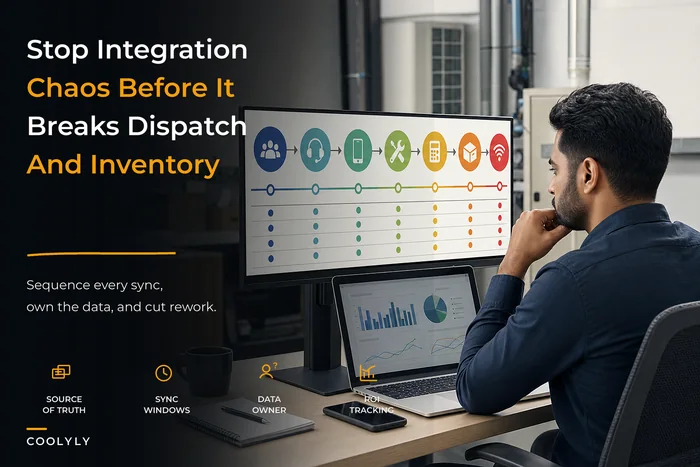
One more thing worth naming: analytics maturity and data maturity aren't the same thing. You can have clean data and no analytics culture. You can also have a sharp ops manager making great calls off messy data. The framework below assumes you want both to grow together, because at scale, gut-feel decisions stop working and dirty data quietly poisons everything downstream. If your source systems don't talk to each other cleanly, none of this holds up — which is why the plumbing matters as much as the reporting. Worth reading through this HVAC integrations and data-architecture playbook before you climb higher.
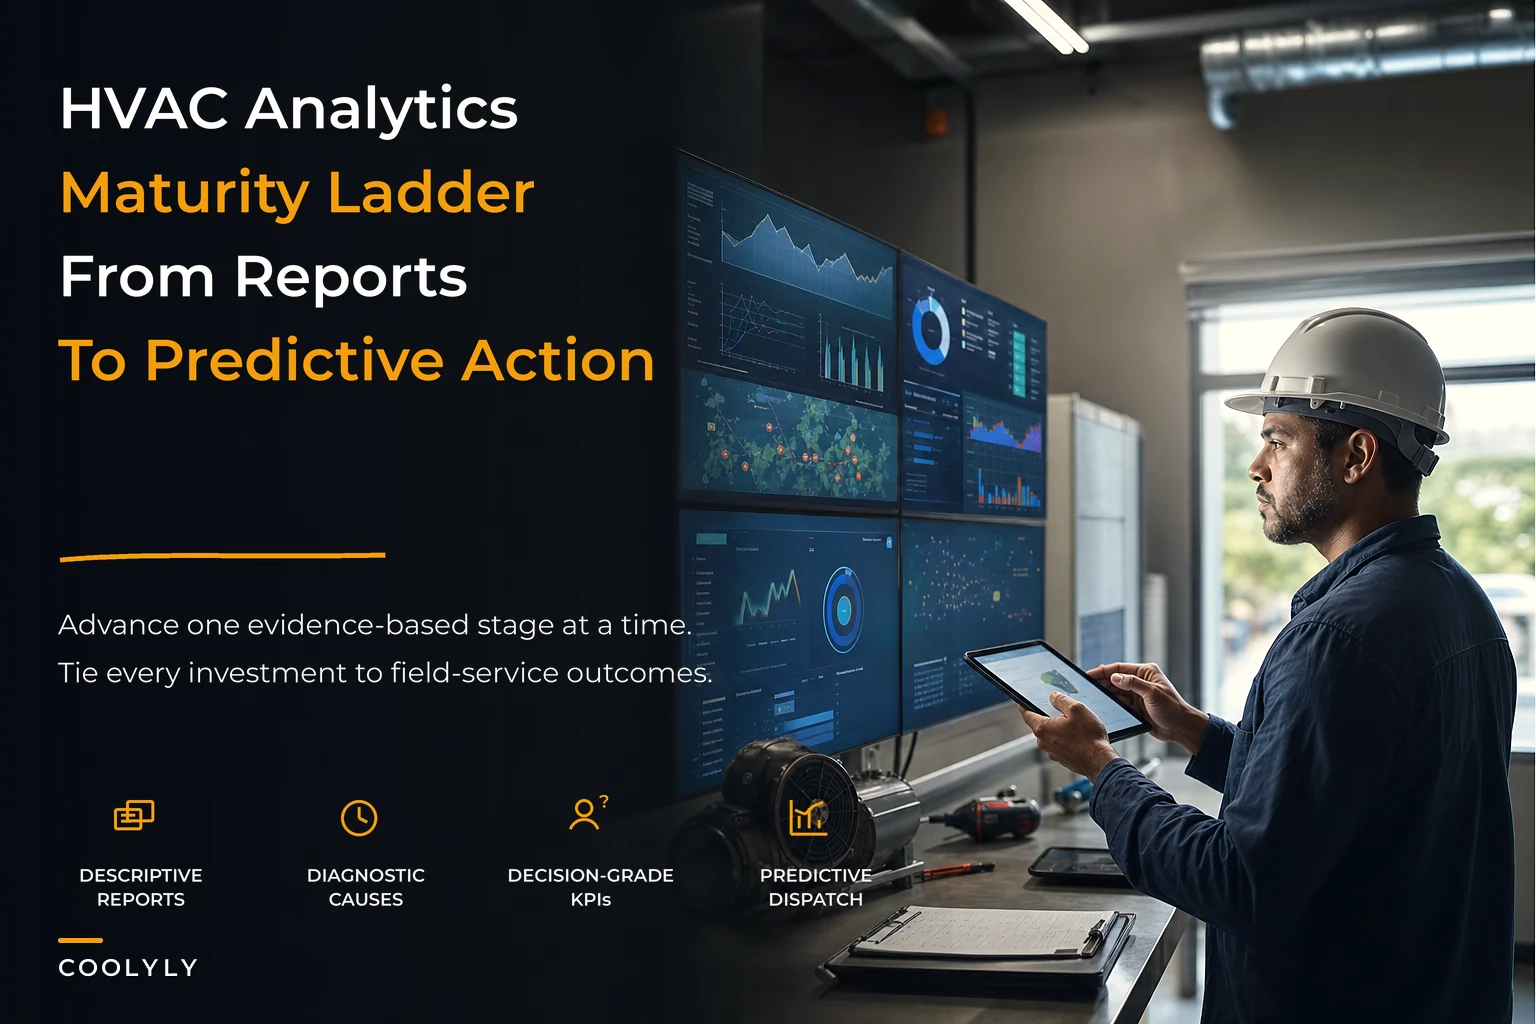
The five-stage maturity ladder
Read the table below as a ladder, not a menu — you climb it in order.
Eliminate scheduling chaos and missed jobs.
Coolyly helps HVAC companies book, coordinate, and track every service efficiently.
- Unified appointment & dispatch management
- Automated client notifications
- Technician scheduling & job tracking
No credit card required
| Stage | What you can measure | Primary KPI focus | Governance owner | Typical ROI checkpoint |
|---|---|---|---|---|
| 1. Reactive | Basic counts (jobs, revenue, callbacks) | Revenue-per-tech, callback count | Owner / GM | Do the numbers reconcile with accounting? |
| 2. Measured | Trusted, defined KPIs | FTFR, MTTR baseline | Ops manager | Are two people reading the same number the same way? |
| 3. Diagnostic | Root-cause segmentation | FTFR by cause, MTTR by job type | Dedicated analytics owner | Did one fixed root cause move a KPI? |
| 4. Predictive | Forecasting & routing logic | Parts fill-rate, MTTR reduction | Ops + analytics jointly | Fewer second trips, measurably |
| 5. Optimized | Closed-loop, self-correcting | All four, tied to margin | Cross-functional council | Compounding margin gains |
Most independent HVAC shops live somewhere between stage one and two and think they're at stage three. That mismatch is probably the single most common thing holding companies back — they buy predictive tooling while their FTFR definition still changes depending on who you ask.
Stage 1 — Reactive: get the counts to reconcile
At this stage you're pulling totals. Jobs completed, revenue booked, callbacks that came in. It feels primitive, but there's real work here, and skipping it is why higher stages collapse.
The job of stage one is reconciliation, not insight. If your dispatch software says you ran 340 jobs last month and your accounting says you invoiced 318, you have a leak — and no analytics investment above this stage will make sense until you know where those 22 jobs went. In real operations this usually happens when techs close jobs in the field but the invoice never syncs, or when warranty and comeback work gets logged as new jobs and inflates your volume count.
Governance role at stage one: the owner or GM personally owns the reconciliation. Not delegated yet. You need one person who feels the pain of numbers not matching.
ROI checkpoint before climbing: can you close a month and have field counts, dispatch counts, and accounting agree within a small margin? If not, fix the plumbing first.
Pro-tip: make reconciliation a recurring calendar task owned by the GM to keep it from slipping.
The mistake people make here is treating reconciliation as a bookkeeping chore instead of an analytics foundation. Every unreconciled job is a data point lying to you later.
Stage 2 — Measured: define KPIs so two people can't disagree
Now you introduce the four core numbers as defined metrics. This is harder than it sounds because most shops have never actually written down what FTFR means for them.
Real question that stalls teams for weeks: does a first-time fix count if the tech diagnosed correctly but had to order a part? Some shops say no fix, no credit. Others say a correct diagnosis with a scheduled parts return still counts as first-time because the tech didn't fail — the truck stock did. Neither answer is wrong. But you have to pick one and freeze it, because an undefined KPI is worse than no KPI. People will game whichever interpretation flatters them.
-
MTTR — do you measure from call-received or from tech-on-site? Residential and commercial often need different clocks.
-
Parts fill-rate — is it "part was on the truck" or "part was available somewhere in the company same-day"?
-
Revenue-per-tech — gross ticket, or after material cost?
Governance role: this is where you hand ownership to an ops manager and write a one-page KPI dictionary. Boring. Essential.
ROI checkpoint: pull the same KPI two ways, from two people, and confirm they land in the same place. If your dispatcher's FTFR and your manager's FTFR differ by ten points, you're not at stage two yet.
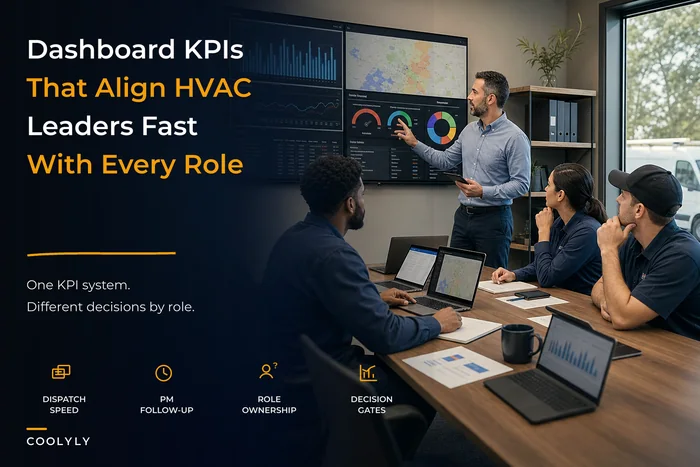
This is also the natural moment to standardize how leadership actually sees these numbers, because a defined KPI still fails if everyone's looking at a different view of it. Role-based dashboards — where the owner, ops manager, and dispatcher each see the slice they can act on — are worth setting up here. The logic behind that is laid out in this piece on role-based dashboard templates and governance rules.
Stage 3 — Diagnostic: stop measuring symptoms, start segmenting causes
This is where analytics starts paying for itself, and also where most companies get stuck because it requires a discipline they didn't need before.
A single FTFR number is a symptom. A stage-three shop breaks it apart:
-
FTFR by cause of failure — diagnostic miss vs. parts unavailable vs. wrong tech dispatched vs. access problem.
-
MTTR by job type — a no-cool call and a full compressor replacement should never be measured against the same clock.
-
Parts fill-rate by SKU velocity — your fill-rate on common capacitors tells you nothing about your fill-rate on the odd blower motor that actually caused the second trip.
-
Revenue-per-tech by job mix, so you don't punish a tech who ran all the low-ticket maintenance calls that week.
The insight that actually moves budgets: in most shops, a mediocre FTFR isn't one problem — it's three smaller problems stacked. Maybe 40% of your first-time-fix failures trace to parts, 35% to diagnostic gaps on specific equipment, and 25% to dispatch sending a residential tech to a light commercial rooftop. Each one needs a completely different fix. Buying more truck stock does nothing for the diagnostic 35%.
Governance role: now you can justify a dedicated analytics owner — could be a sharp ops coordinator, not necessarily a data hire. Their job is maintaining the segmentation and running root-cause reviews.
ROI checkpoint: pick one root cause, fix it, and prove the KPI moved. If you attacked the parts-availability slice and second trips on those SKUs dropped noticeably, stage three is earning its keep.
When stage three actually makes sense
You're ready for diagnostic analytics when your KPIs are trusted, your data reconciles, and you have enough volume for segments to be meaningful. Under roughly 1,500–2,000 jobs a year, your segments get so thin that one weird week distorts everything. Below that threshold, run stage three quarterly instead of monthly so the sample sizes hold.
When it's a bad idea
If you're still arguing about KPI definitions, segmentation just multiplies the confusion. And if your source systems don't tag jobs consistently, you'll be segmenting garbage — clean tagging at the point of work has to come first.
[Reconciled counts] → [Frozen KPI definitions] → [Consistent job tagging] → [Root-cause segmentation] → [One fix, prove the KPI moved]
Getting through that sequence in order is the whole point of the first three stages. Shops that skip the middle steps end up with dashboards that look sophisticated but can't actually answer "why."
Stage 4 — Predictive: forecasting parts and routing before the failure
Stage four is where analytics stops describing the past and starts shaping the next dispatch. This layer directly attacks MTTR and parts fill-rate together.
The core moves:
-
Parts forecasting by season and install base. If you know the age and model distribution of the systems you service, you can predict which failures spike in the first heat wave and pre-stock accordingly. Fill-rate stops being reactive.
-
Predictive dispatch matching. Using historical FTFR-by-cause data, the system routes the tech most likely to close that specific job type first-time, instead of just the nearest available truck.
-
MTTR modeling. You start forecasting how long job types actually take versus scheduled, which fixes the chronic over/under-booking that wrecks your day by 2 PM.
A predictive layer is also where preventive-maintenance data becomes an offensive weapon rather than a filing cabinet. When your PM history feeds the failure model, you're not guessing which units are about to go — you're scheduling around it. The mechanics of turning that recurring service data into forecastable revenue are covered in this piece on building a data-driven preventive maintenance program.
Governance role: ops and analytics own this jointly. Analytics builds the model; ops has veto power over anything that doesn't match field reality, because a model that ignores your best tech being out on leave is worse than no model.
ROI checkpoint: measurable reduction in second trips and a fill-rate that holds through peak season without emergency parts runs. If you're still doing $200 same-day counter pickups every afternoon in July, the prediction isn't landing yet.
Here's a simple workflow to visualize how predictive parts forecasting and dispatch feed operational decisions.
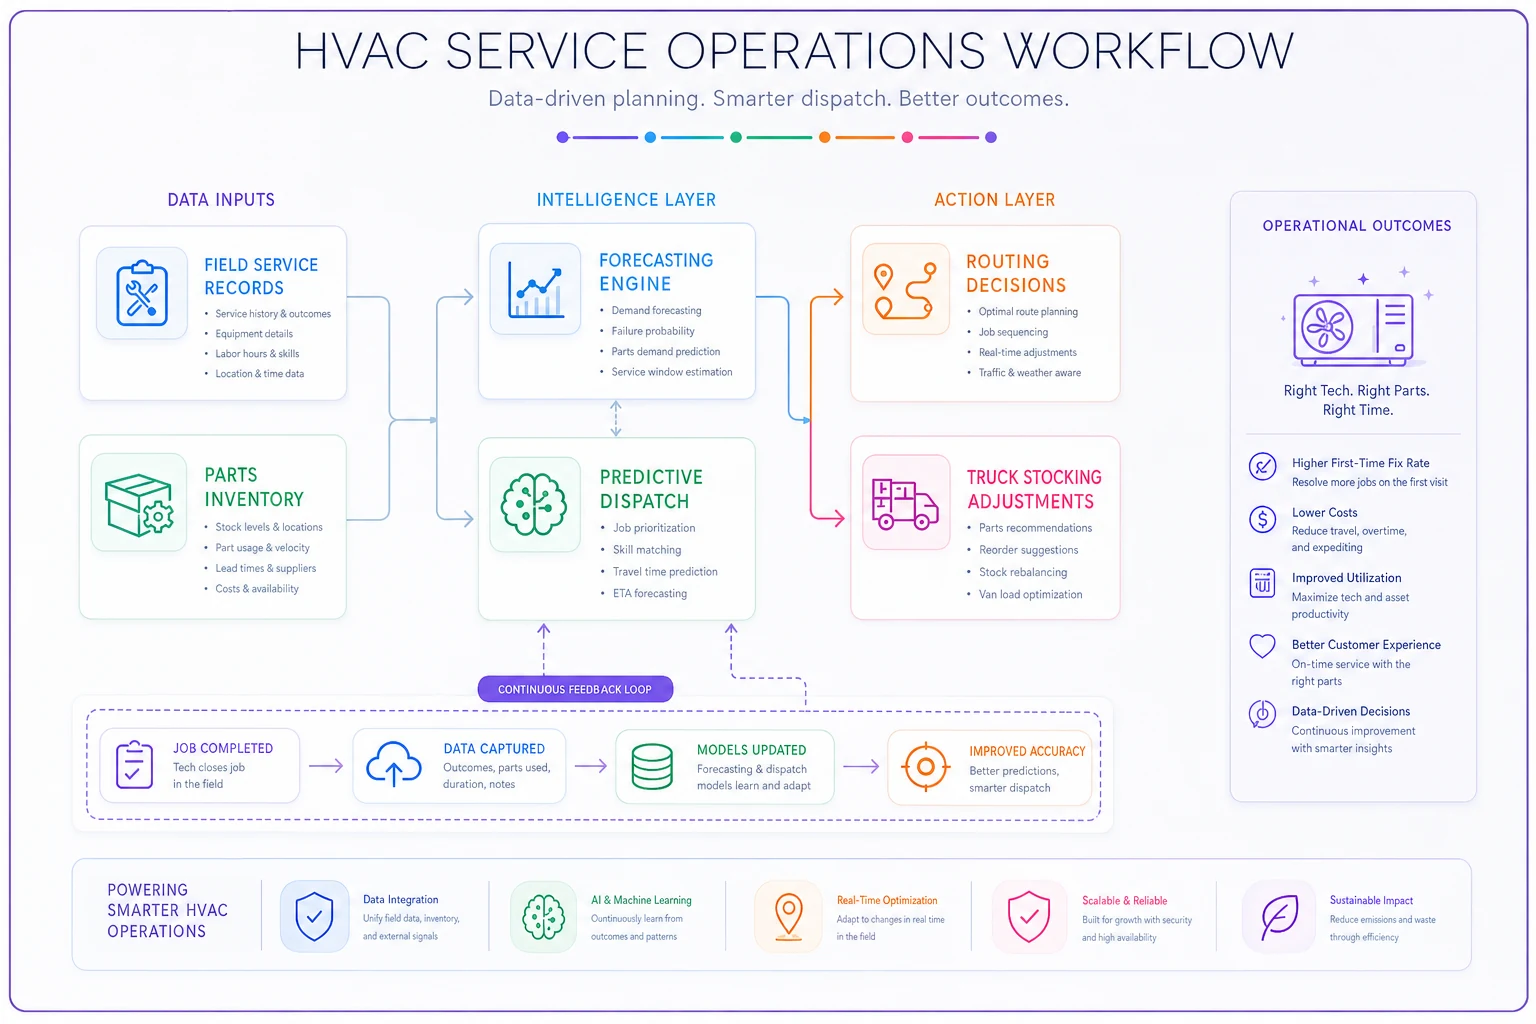
This diagram shows the flow from data to routing to stock decisions and the feedback loop to improve models.
Stage 5 — Optimized: the closed loop
Very few independent HVAC companies reach stage five, and honestly not all of them need to. This is where every KPI feeds back into the system and the operation self-corrects.
At this stage a callback doesn't just get logged — it automatically re-weights that tech's dispatch profile, flags the SKU for a truck-stock review, and updates the MTTR model for that job type. The four KPIs stop being separate reports and become one connected margin picture: you can see that a two-point FTFR improvement on rooftop units drove MTTR down, which raised revenue-per-tech, which showed up in month-end margin.
Stage-five companies don't have fancier dashboards than stage-four companies. They have tighter loops — the time between "a problem happened" and "the system adjusted" shrinks from weeks to days. That's the whole game.
Governance role: a small cross-functional council — ops, parts, and finance — meets on a fixed cadence to review the loop, not the raw numbers.
A quick real scenario
A residential-and-light-commercial shop running six trucks, roughly 3,600 jobs a year, sat stuck at a 68% FTFR and a parts fill-rate they described as "fine, mostly." Their real problem was that they'd jumped straight to buying predictive routing software while still at stage two — undefined KPIs, no root-cause segmentation.
They backed down a rung. Spent about six weeks nailing definitions and reconciling counts, then segmented their first-time-fix failures. Turned out roughly half their misses traced to two dozen parts that weren't on the trucks, and another chunk to one job type — inverter mini-splits — where only two of their six techs were confident.
They didn't buy anything new. They re-kitted trucks around the actual failure data and put the weaker techs through targeted training on that one system family. Over the next couple of quarters FTFR moved into the high 70s, second trips dropped noticeably, and revenue-per-tech climbed because trucks stopped burning half a day on return visits. The predictive tool they'd already paid for finally started working — because the data underneath it was finally trustworthy.
The lesson wasn't "buy better software." It was "match your analytics investment to your actual maturity stage."
A climbing checklist you can actually use
Before you spend on the next analytics layer, run through this:
-
[ ] Field counts, dispatch counts, and accounting reconcile within a small margin (Stage 1 done)
-
[ ] Every core KPI has a written, frozen definition (Stage 2 gate)
-
[ ] Two different people read the same KPI the same way
-
[ ] Jobs are tagged consistently at the point of work, not cleaned up later
-
[ ] You can break at least one KPI into root-cause segments (Stage 3 gate)
-
[ ] You've fixed one root cause and proven a KPI moved
-
[ ] You have enough job volume for segments to be statistically real
-
[ ] Ops has veto power over any predictive model output (Stage 4 governance)
-
[ ] Each KPI has a named owner, not a committee-of-nobody
If you can't check the boxes for a stage, that's your answer on where to spend next.
Where tooling honestly fits
None of this requires an enterprise data warehouse. What it requires is that your systems capture clean, consistently-tagged data at the point of work and surface the right slice to the right person. That's the realistic role for operational software here — not to hand you a magic KPI, but to make reconciliation, tagging, segmentation, and routing something that happens inside the daily workflow instead of in a spreadsheet somebody updates on Friday afternoon.
Where automation genuinely helps is the boring, error-prone glue: syncing counts so nothing vanishes between systems, tagging failure causes consistently without relying on techs to remember a dropdown, and flagging when a KPI drifts before you'd have caught it manually.
The tool is the ladder's handrail. It doesn't climb for you.
Bottom line
The companies that get real returns from HVAC analytics aren't the ones with the most sophisticated tools. They're the ones who matched each investment to their actual operational stage, put a name on every number, and refused to buy stage-four capability while sitting at stage two.
Start where you actually are. Reconcile before you measure. Define before you segment. Prove one fix before you forecast. FTFR, MTTR, parts fill-rate, and revenue-per-tech all improve together when you climb the ladder in order — and they all quietly rot when you try to skip rungs.
Start where you actually are. Reconcile before you measure. Define before you segment. Prove one fix before you forecast. FTFR, MTTR, parts fill-rate, and revenue-per-tech all improve together when you climb the ladder in order — and they all quietly rot when you try to skip rungs.
Ready to optimize your HVAC operations?
Join hundreds of HVAC businesses using Coolyly to save time, improve technician utilization, and enhance customer satisfaction.